Guided Factor Analysis on LUHMES CROP-seq Data
– NTC included, unique UMI count corrected
Yifan Zhou (zhouyf@uchicago.edu)
2021-03-24
1 Single cell expression data
Source:
High-throughput single-cell functional elucidation of neurodevelopmental disease-associated genes reveals convergent mechanisms altering neuronal differentiation, GEO accession: GSE142078.
Perturbations:
CRISPR knock-down of 14 autism spectrum disorder (ASD)–associated genes (3 gRNAs per gene) + 5 non-targeting gRNAs.
Cells:
Lund human mesencephalic (LUHMES) neural progenitor cell line.
Cells from 3 batches were merged together into 1 analysis. All cells have only a single type of gRNA readout. Quality control resulted in 8708 cells.
Genes:
Only genes detected in > 10% of cells were kept, resulted in 6213 genes.
Normalization:
Seurat “LogNormalize”: log(count per 10K + 1).
Batch effect, unique UMI count, library size, and mitochondria percentage were all corrected for. The corrected and scaled expression data were used as input for subsequent factor analysis.
2 Guided results
Here, our “guide”, \(G\) matrix, consists of 15 types (14 genes + NTC) of gene-level knock-down conditions across cells.
In each case, Gibbs sampling was conducted for 2000 iterations, and the posterior mean estimates were averaged over the last 500 iterations.
2.1 SVD Initialization
2.1.1 Local False Sign Rate (LFSR)
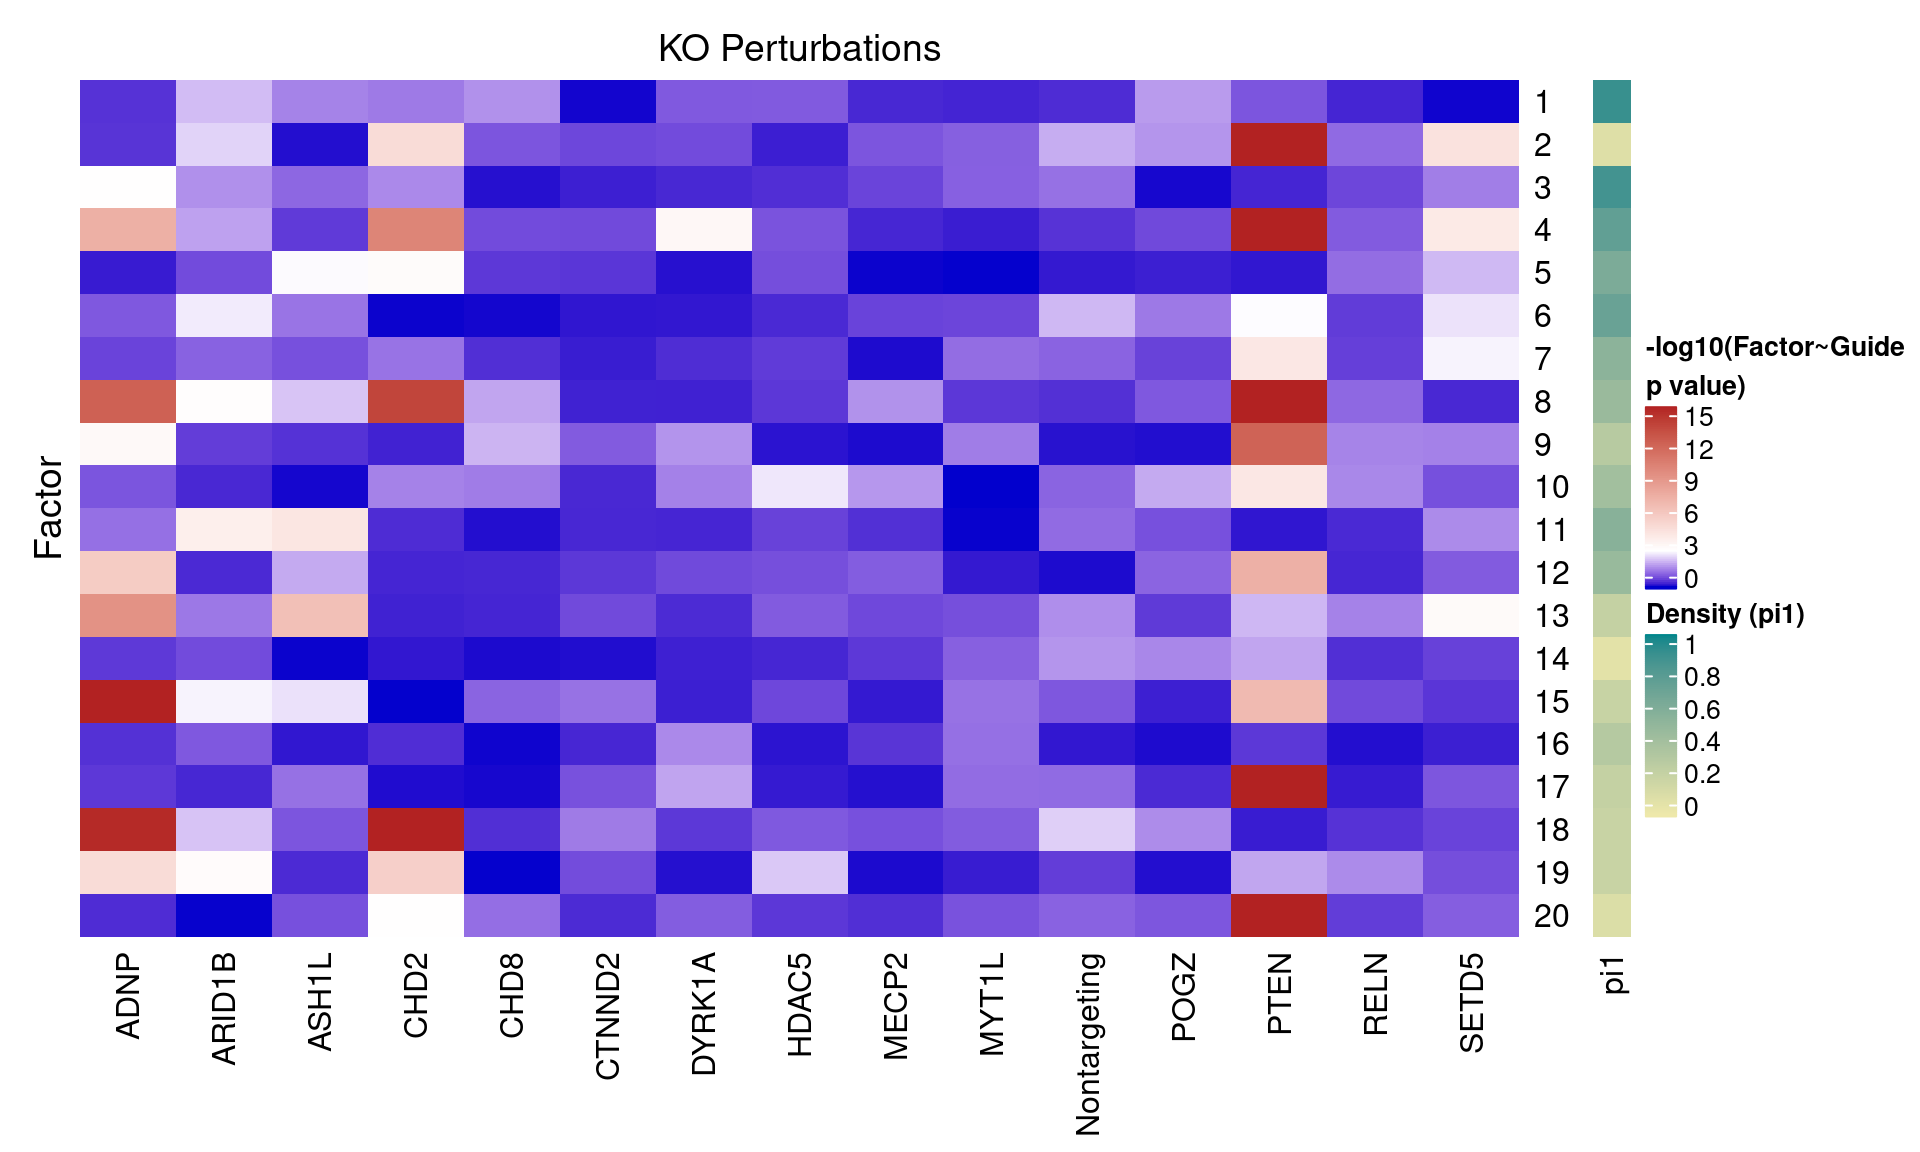
For a given GSFA inference result, we can estimate the effect a certain KO condition \(m\) has on the expression of gene \(j\) by computing the LFSR of \(\beta_{m\cdot} \cdot W_{j\cdot}\).
| KO | ADNP | ARID1B | ASH1L | CHD2 | CHD8 |
| Num_genes | 2092 | 434 | 789 | 1938 | 0 |
| KO | CTNND2 | DYRK1A | HDAC5 | MECP2 | MYT1L |
| Num_genes | 0 | 0 | 0 | 0 | 0 |
| KO | Nontargeting | POGZ | PTEN | RELN | SETD5 |
| Num_genes | 0 | 0 | 2099 | 0 | 987 |
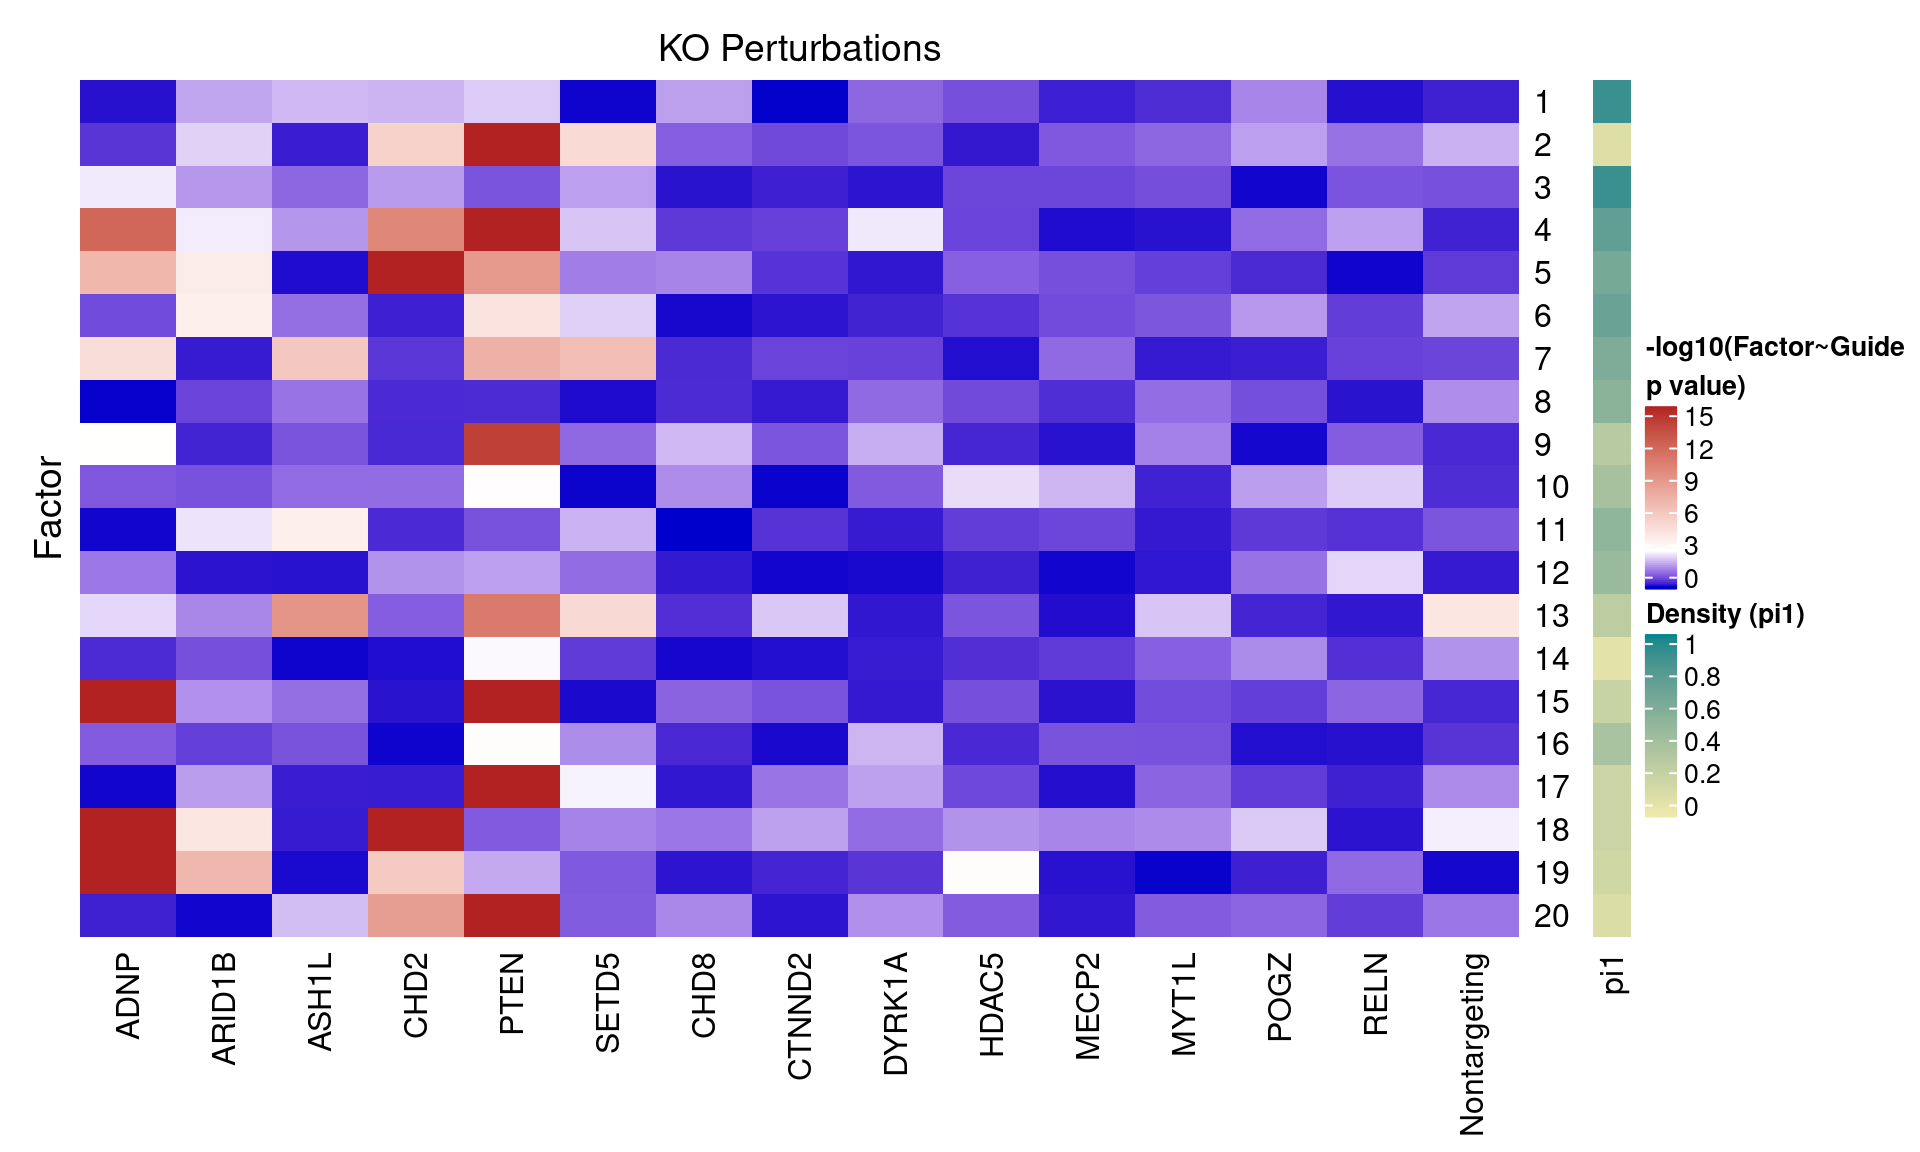
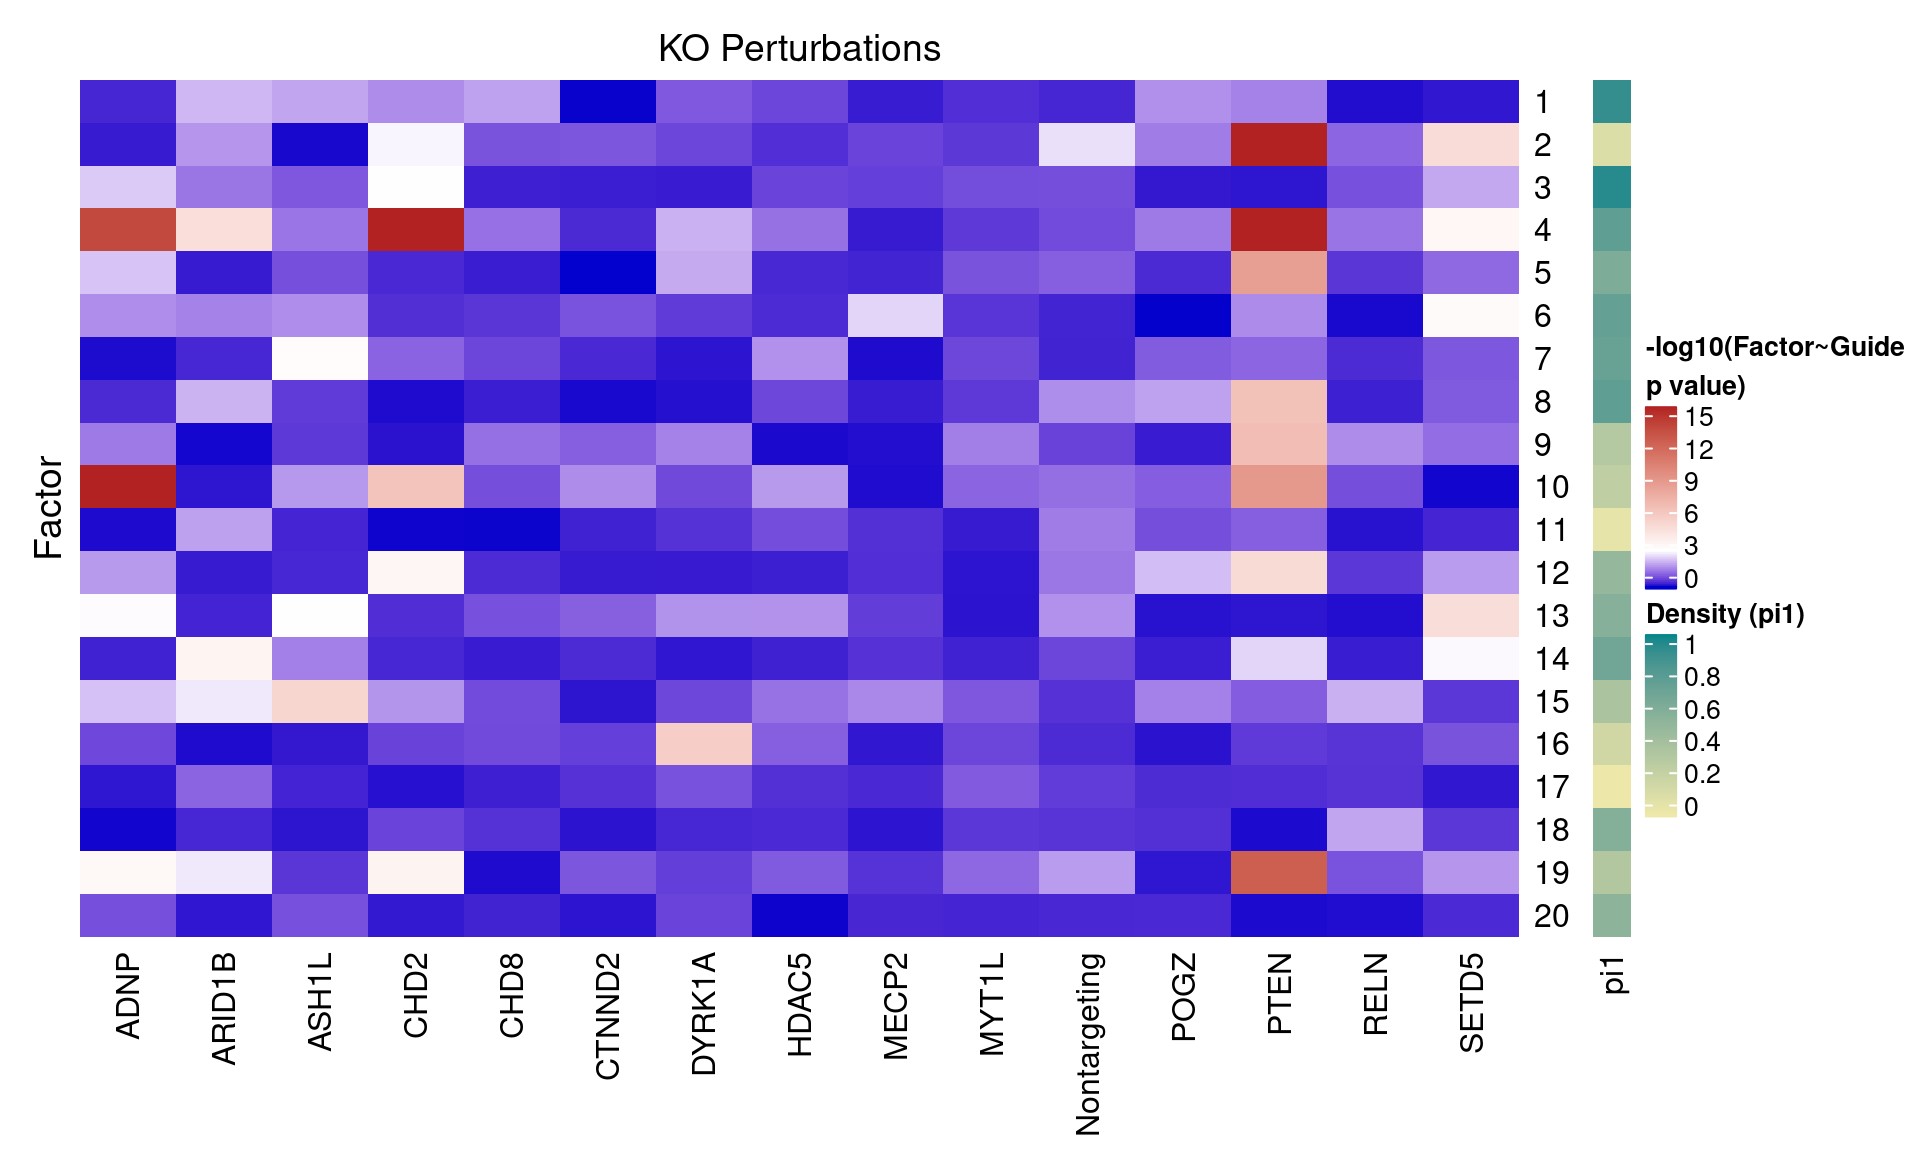
2.1.2 Estimate of Factor ~ Perturbation Associations (\(\beta\))
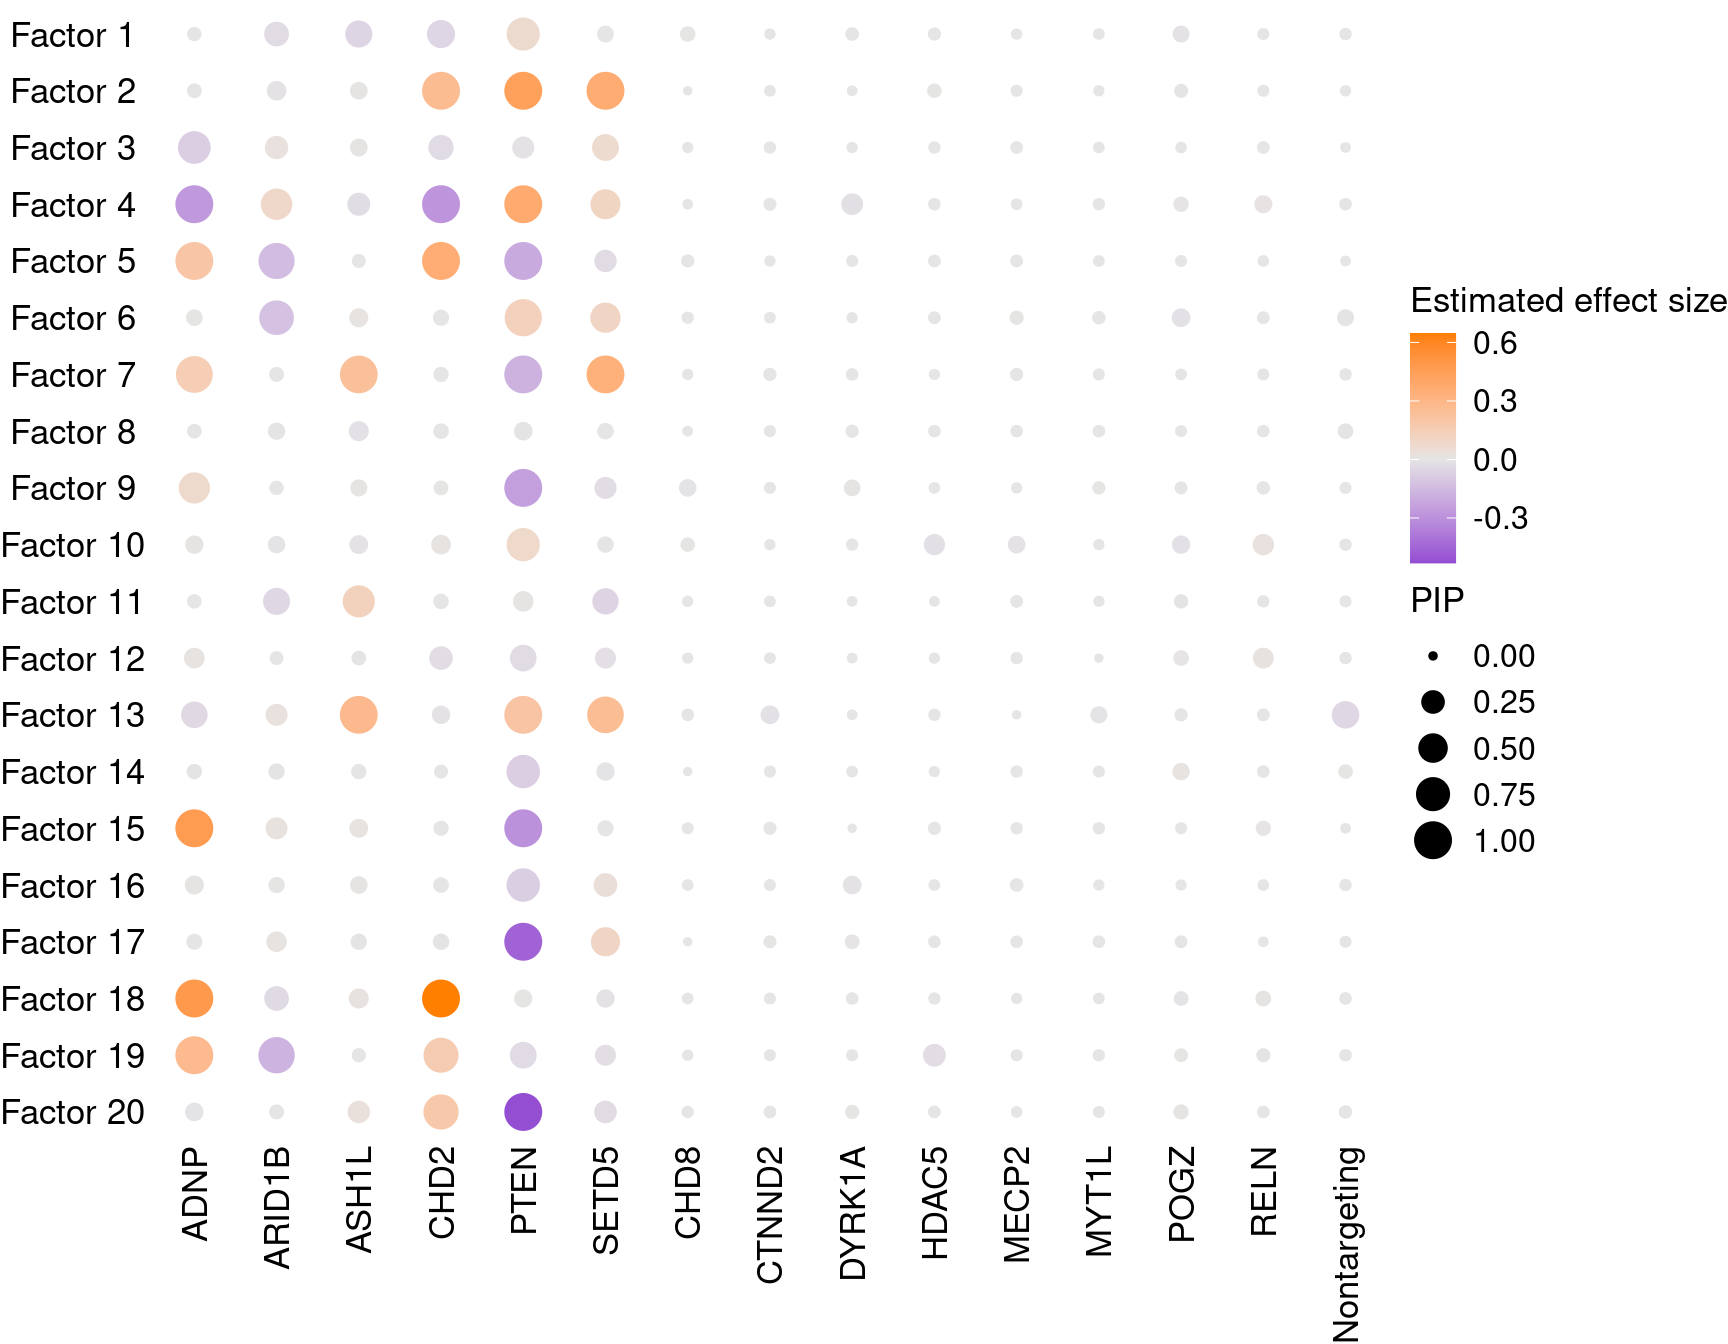
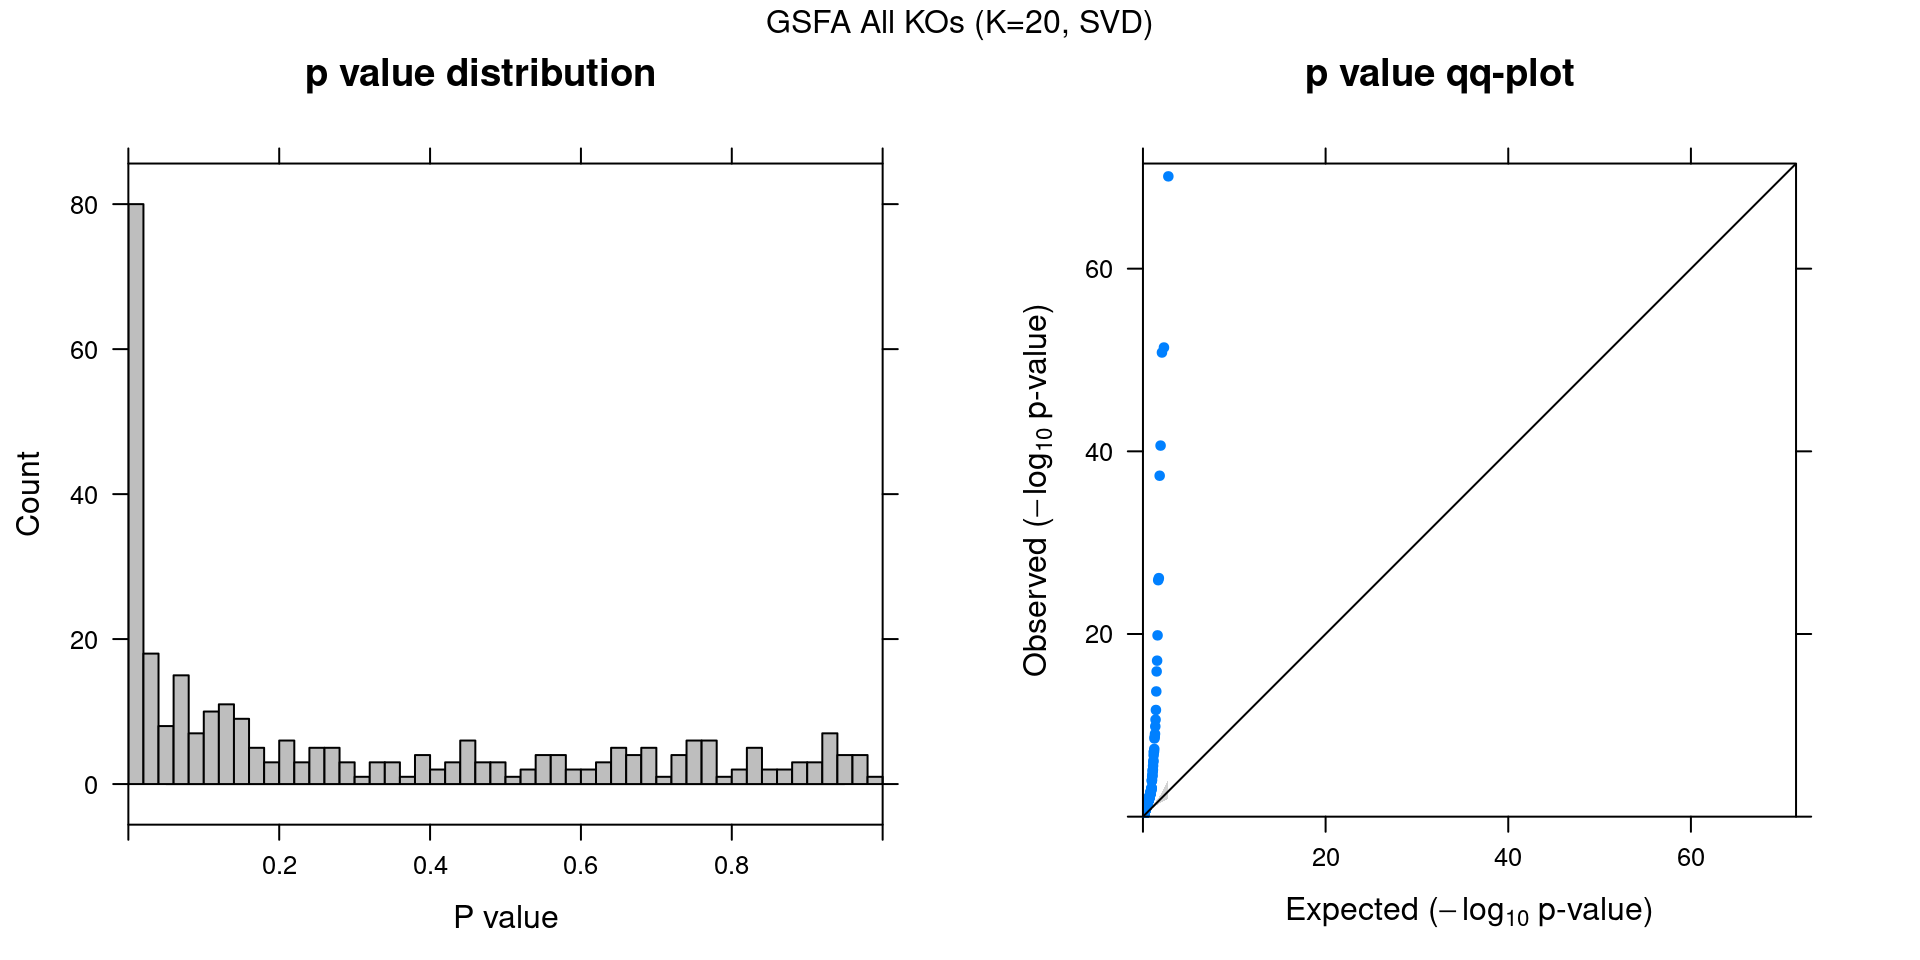
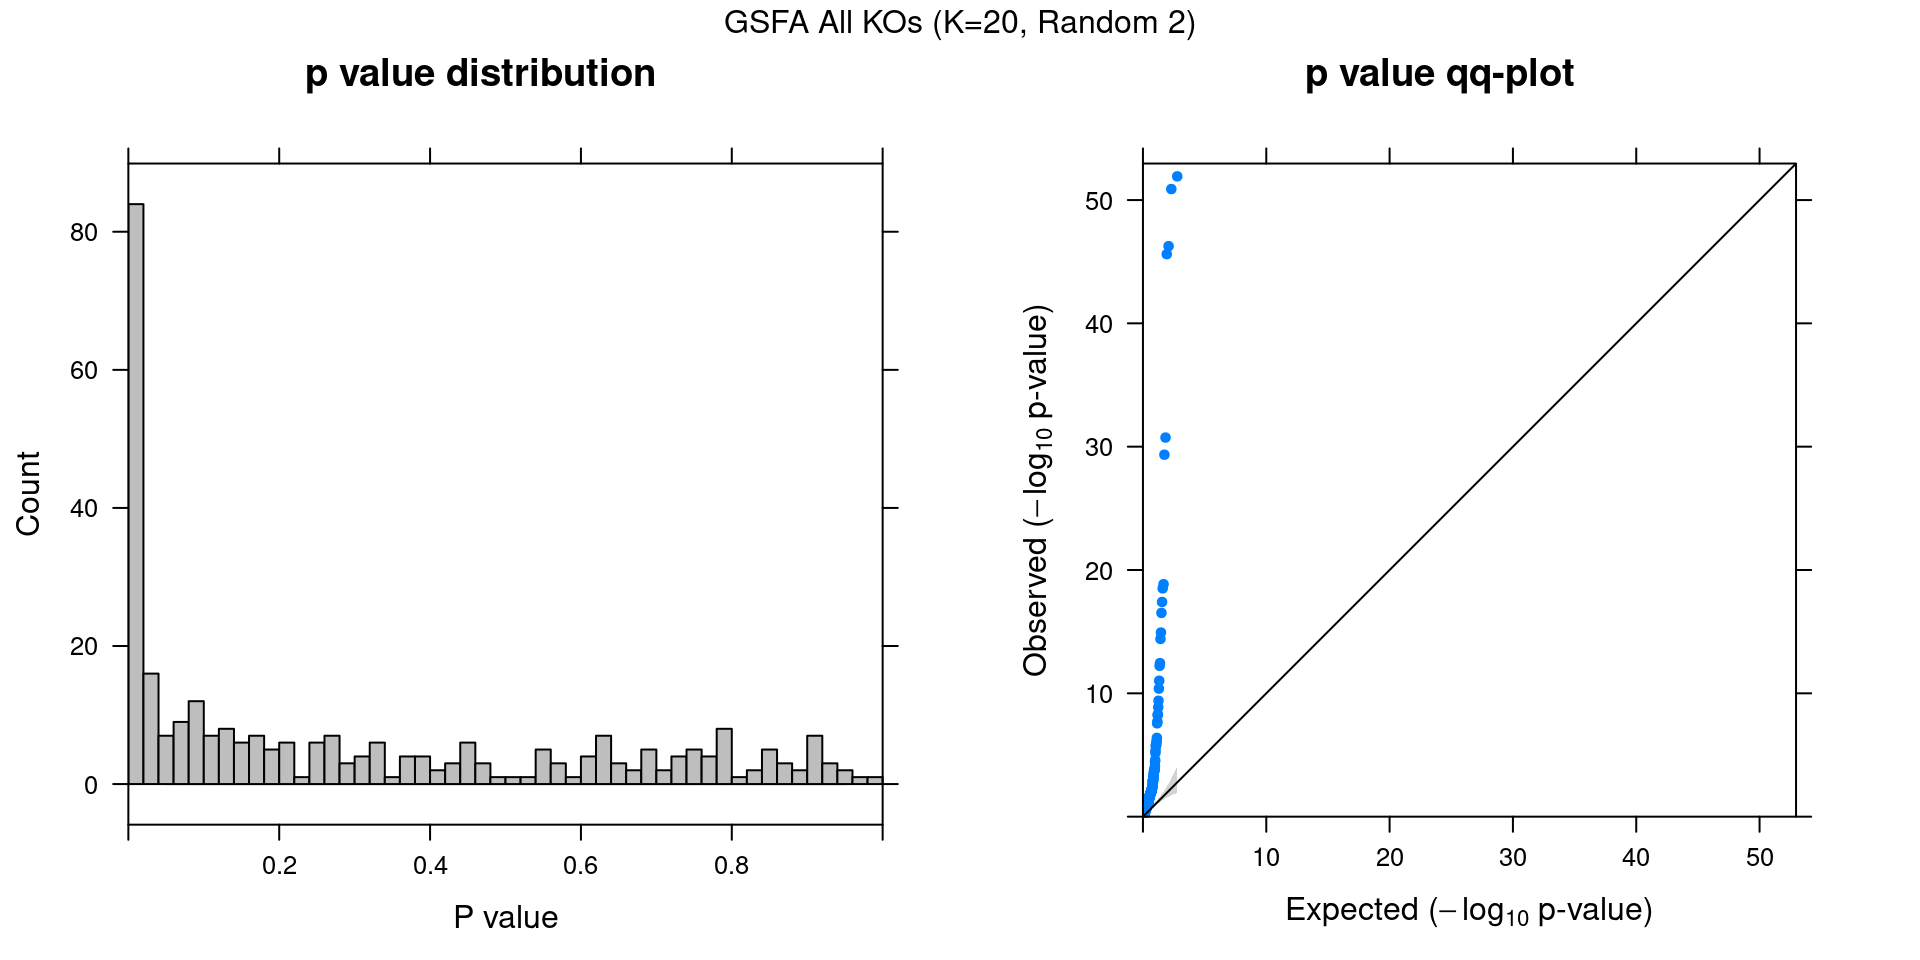
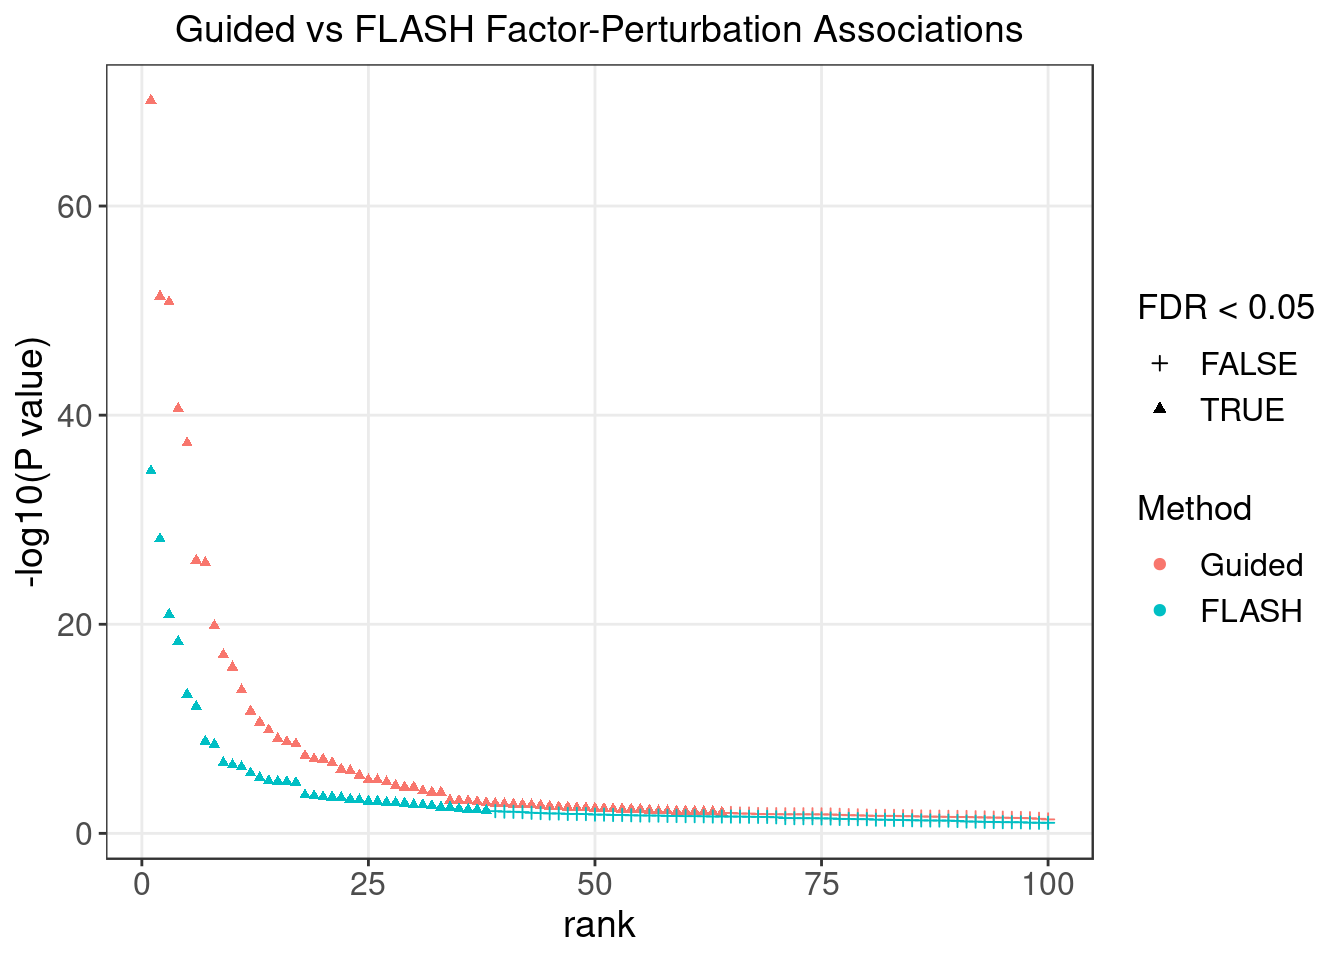
2.1.3 Factor ~ Perturbation Association P Values
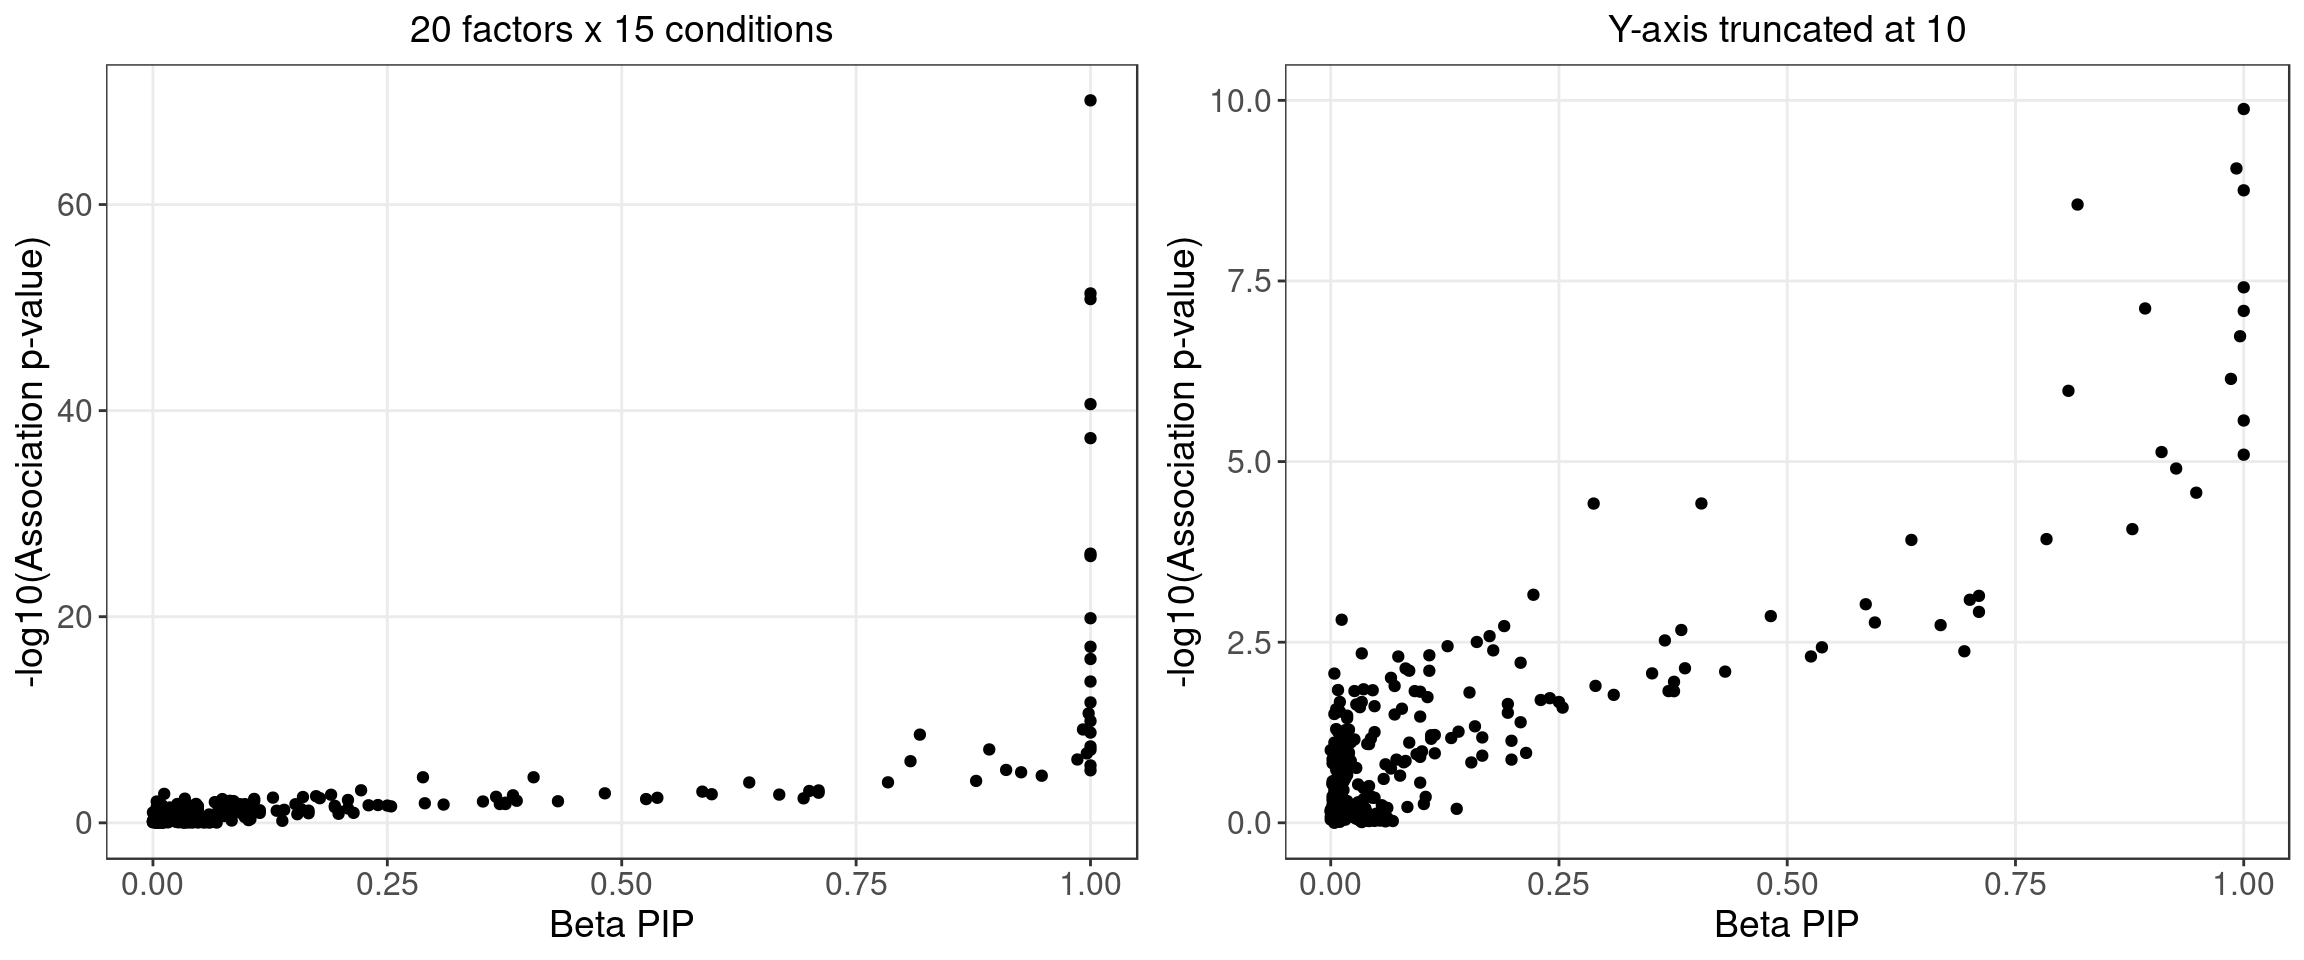
2.1.4 Beta PIP vs P-Value
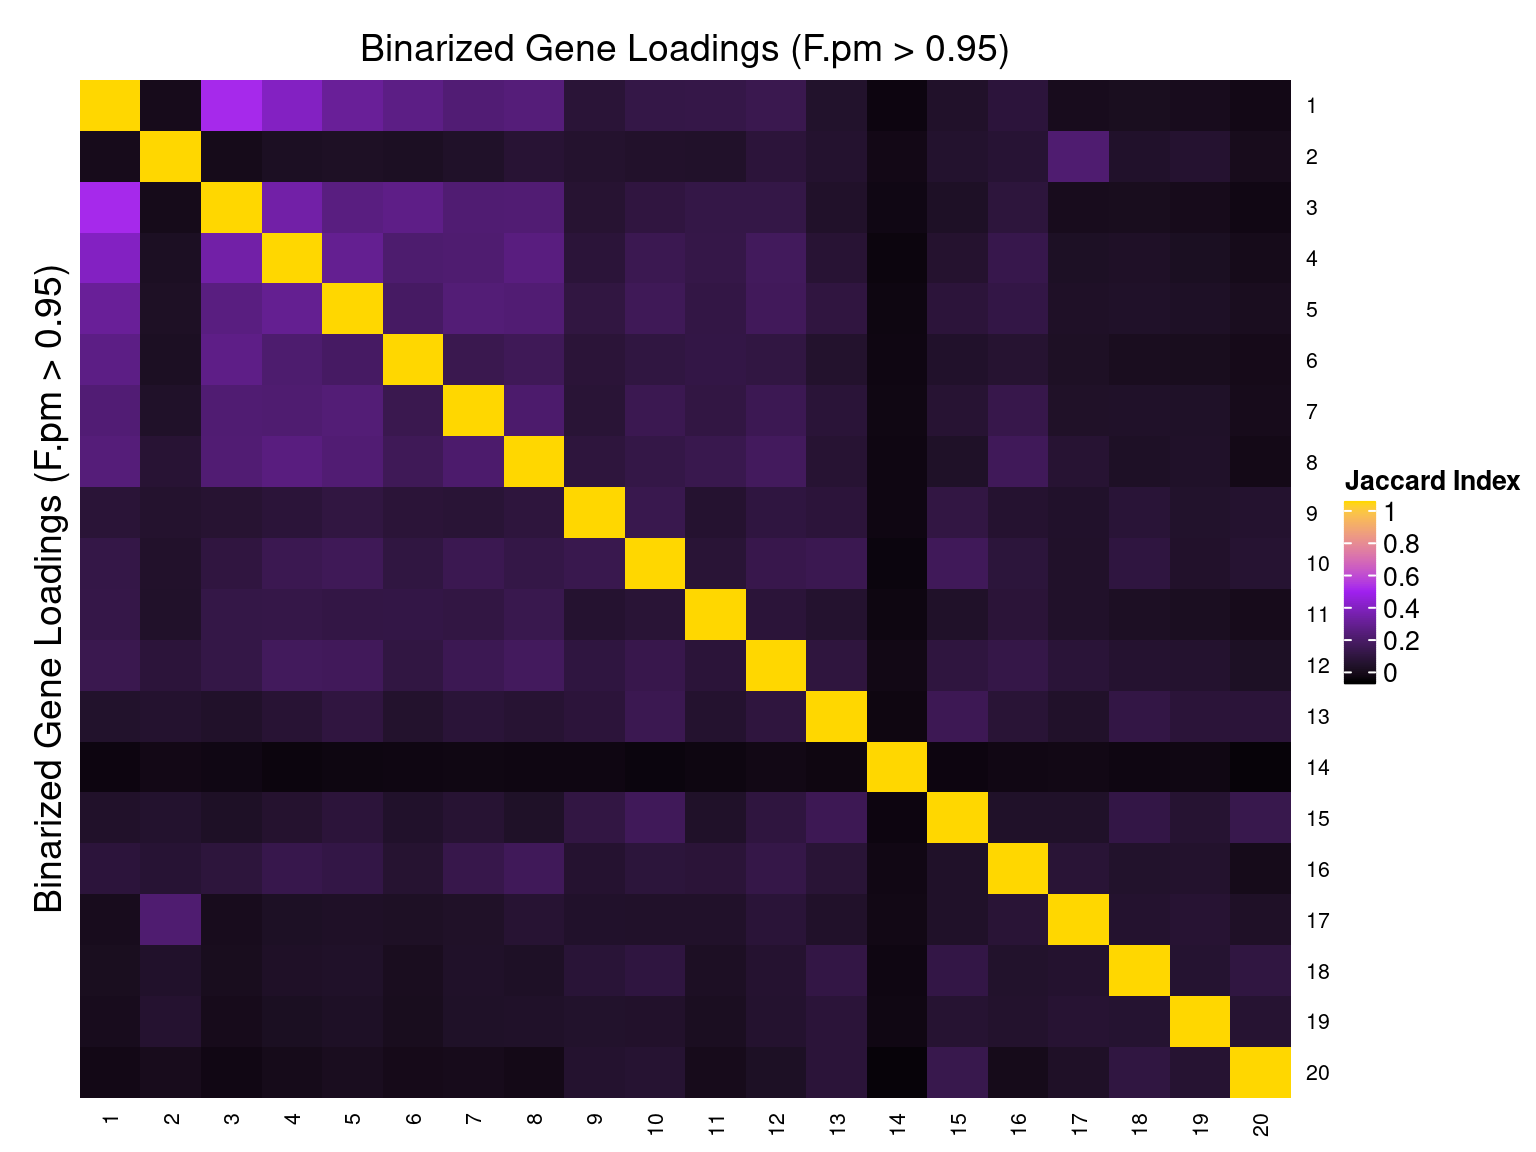
2.1.5 Correlation btw Factors
2.2 Alternative Initializations and Chain Convergence
Other than initializing GSFA using truncated SVD, we also ran 2 chains with random initialization.
2.2.1 Association results for 2 randomly initialized GSFA runs

2.2.2 Chain mixing and convergence evaluation
| Min. | 1st Qu. | Median | Mean | 3rd Qu. | Max. | |
|---|---|---|---|---|---|---|
| ADNP | 0.999 | 1.03 | 1.06 | 1.09 | 1.13 | 1.70 |
| ARID1B | 1.000 | 1.03 | 1.06 | 1.07 | 1.10 | 1.55 |
| ASH1L | 0.999 | 1.02 | 1.04 | 1.06 | 1.08 | 1.52 |
| CHD2 | 0.999 | 1.01 | 1.03 | 1.06 | 1.07 | 1.98 |
| CHD8 | 0.999 | 1.00 | 1.00 | 1.00 | 1.01 | 1.04 |
| CTNND2 | 0.999 | 1.00 | 1.00 | 1.00 | 1.00 | 1.02 |
| DYRK1A | 0.999 | 1.01 | 1.02 | 1.02 | 1.02 | 1.08 |
| HDAC5 | 0.999 | 1.00 | 1.00 | 1.01 | 1.01 | 1.11 |
| MECP2 | 0.999 | 1.00 | 1.00 | 1.00 | 1.00 | 1.02 |
| MYT1L | 0.999 | 1.00 | 1.00 | 1.00 | 1.00 | 1.02 |
| Nontargeting | 0.999 | 1.00 | 1.01 | 1.03 | 1.03 | 1.23 |
| POGZ | 0.999 | 1.00 | 1.00 | 1.00 | 1.00 | 1.05 |
| PTEN | 0.999 | 1.02 | 1.04 | 1.07 | 1.09 | 1.60 |
| RELN | 0.999 | 1.00 | 1.01 | 1.01 | 1.01 | 1.07 |
| SETD5 | 1.000 | 1.03 | 1.06 | 1.08 | 1.11 | 1.64 |
| offset | 0.999 | 1.01 | 1.03 | 1.13 | 1.14 | 2.69 |
2.2.3 Difference btw methods in factor estimation
For a pair of \(Z\) estimations from 2 inference methods, \(Z_1, Z_2\), we quantify the pairwise estimation difference as \(||Z_1Z_1^T - Z_2Z_2^T||_F/N\), where \(||\cdot||\) is the Frobenius norm of a matrix, and \(N\) is the number of rows (samples) in \(Z\).
Guided SVD vs Rand_01: 0.752
Guided SVD vs Rand_02: 0.56
Rand_01 vs Rand_02: 0.611
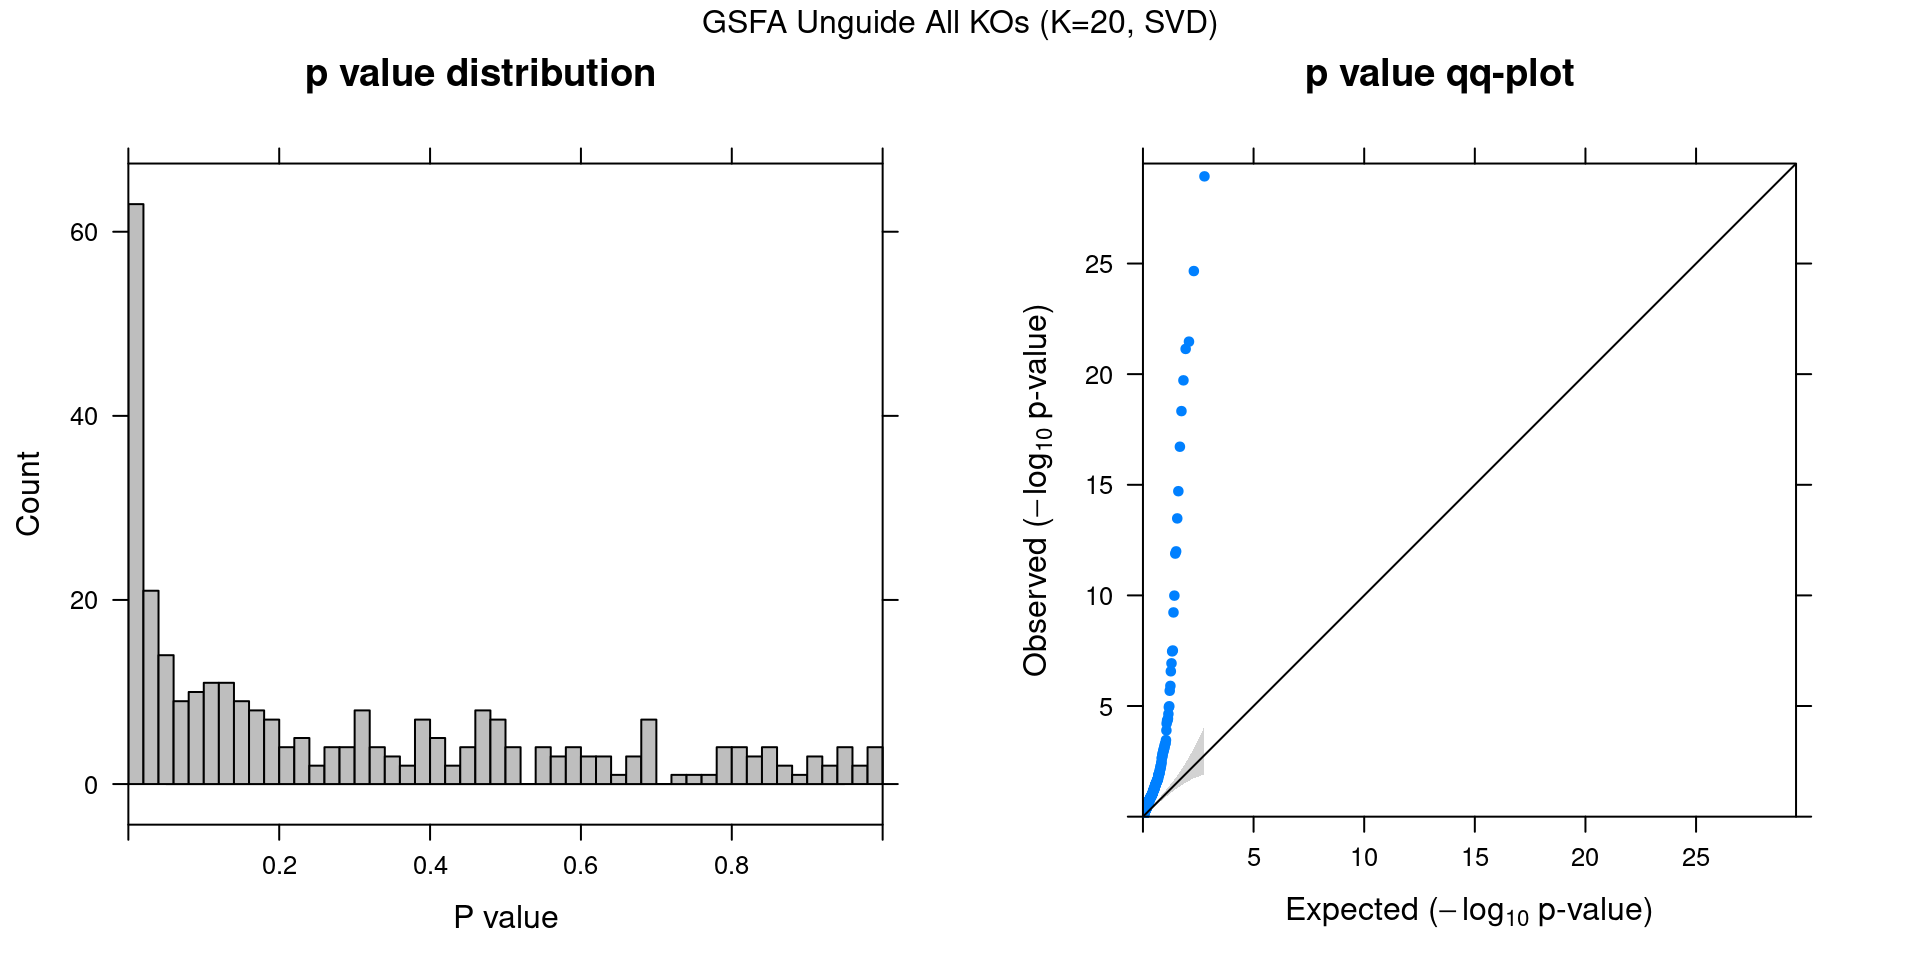
3 Unguided Result
In contrast to the guided version, here we provide no guidance (\(G = \vec{0}\)) to our sparse factor analysis model to serve as a comparison.
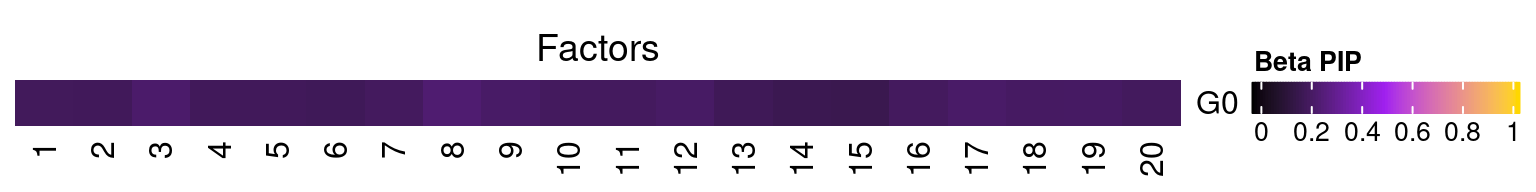
3.1 Factor ~ KO Beta PIP
3.2 Factor ~ KO Posterior Association
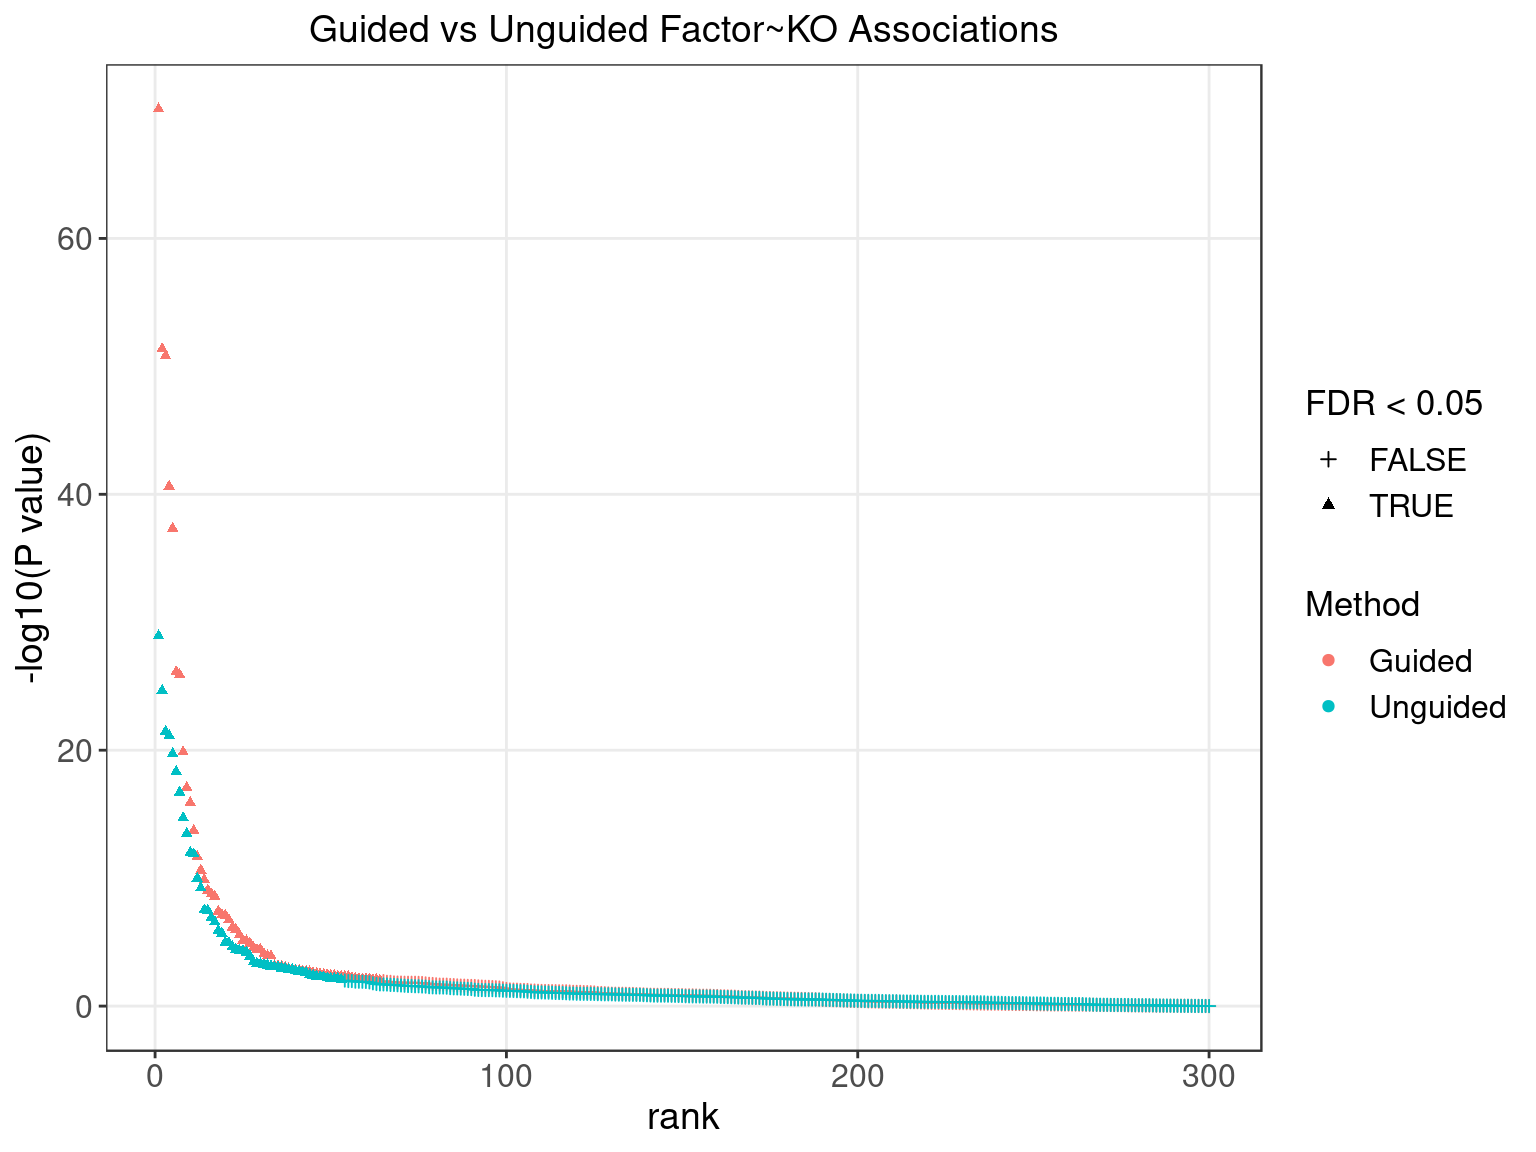
3.3 Unguided vs Guided
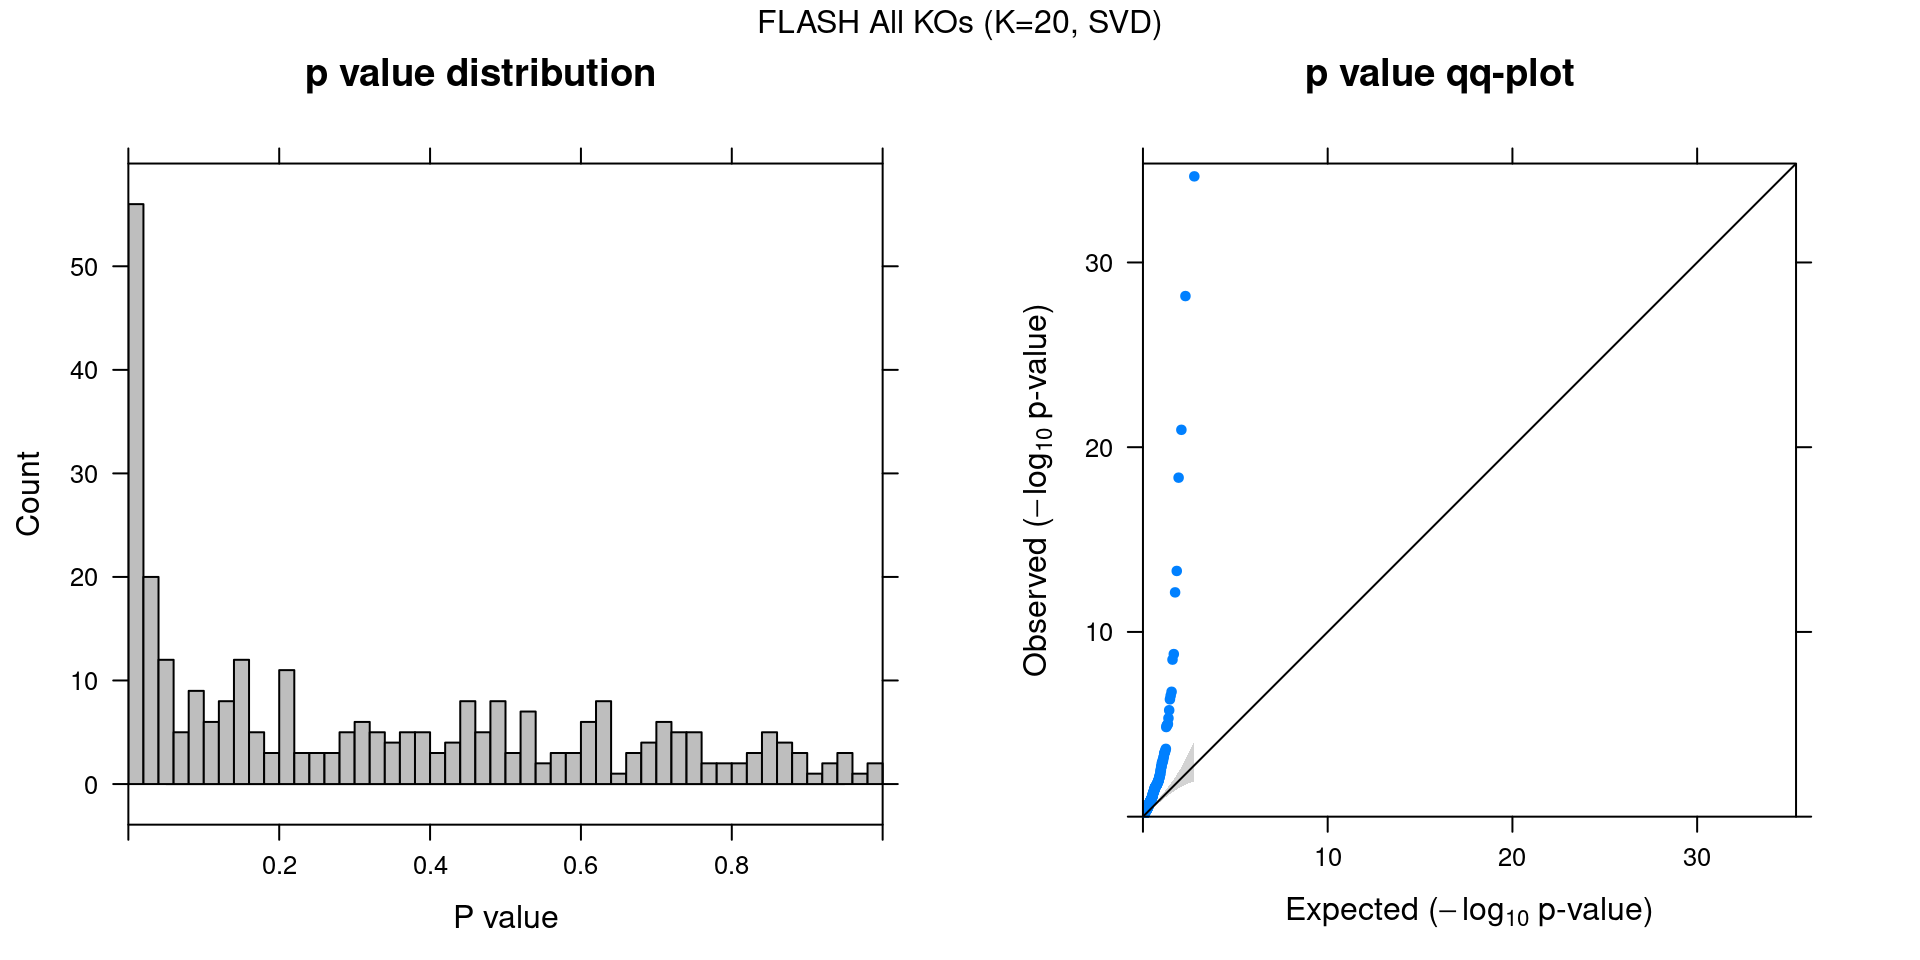
4 FLASH
4.1 Factor ~ KO Posterior Association
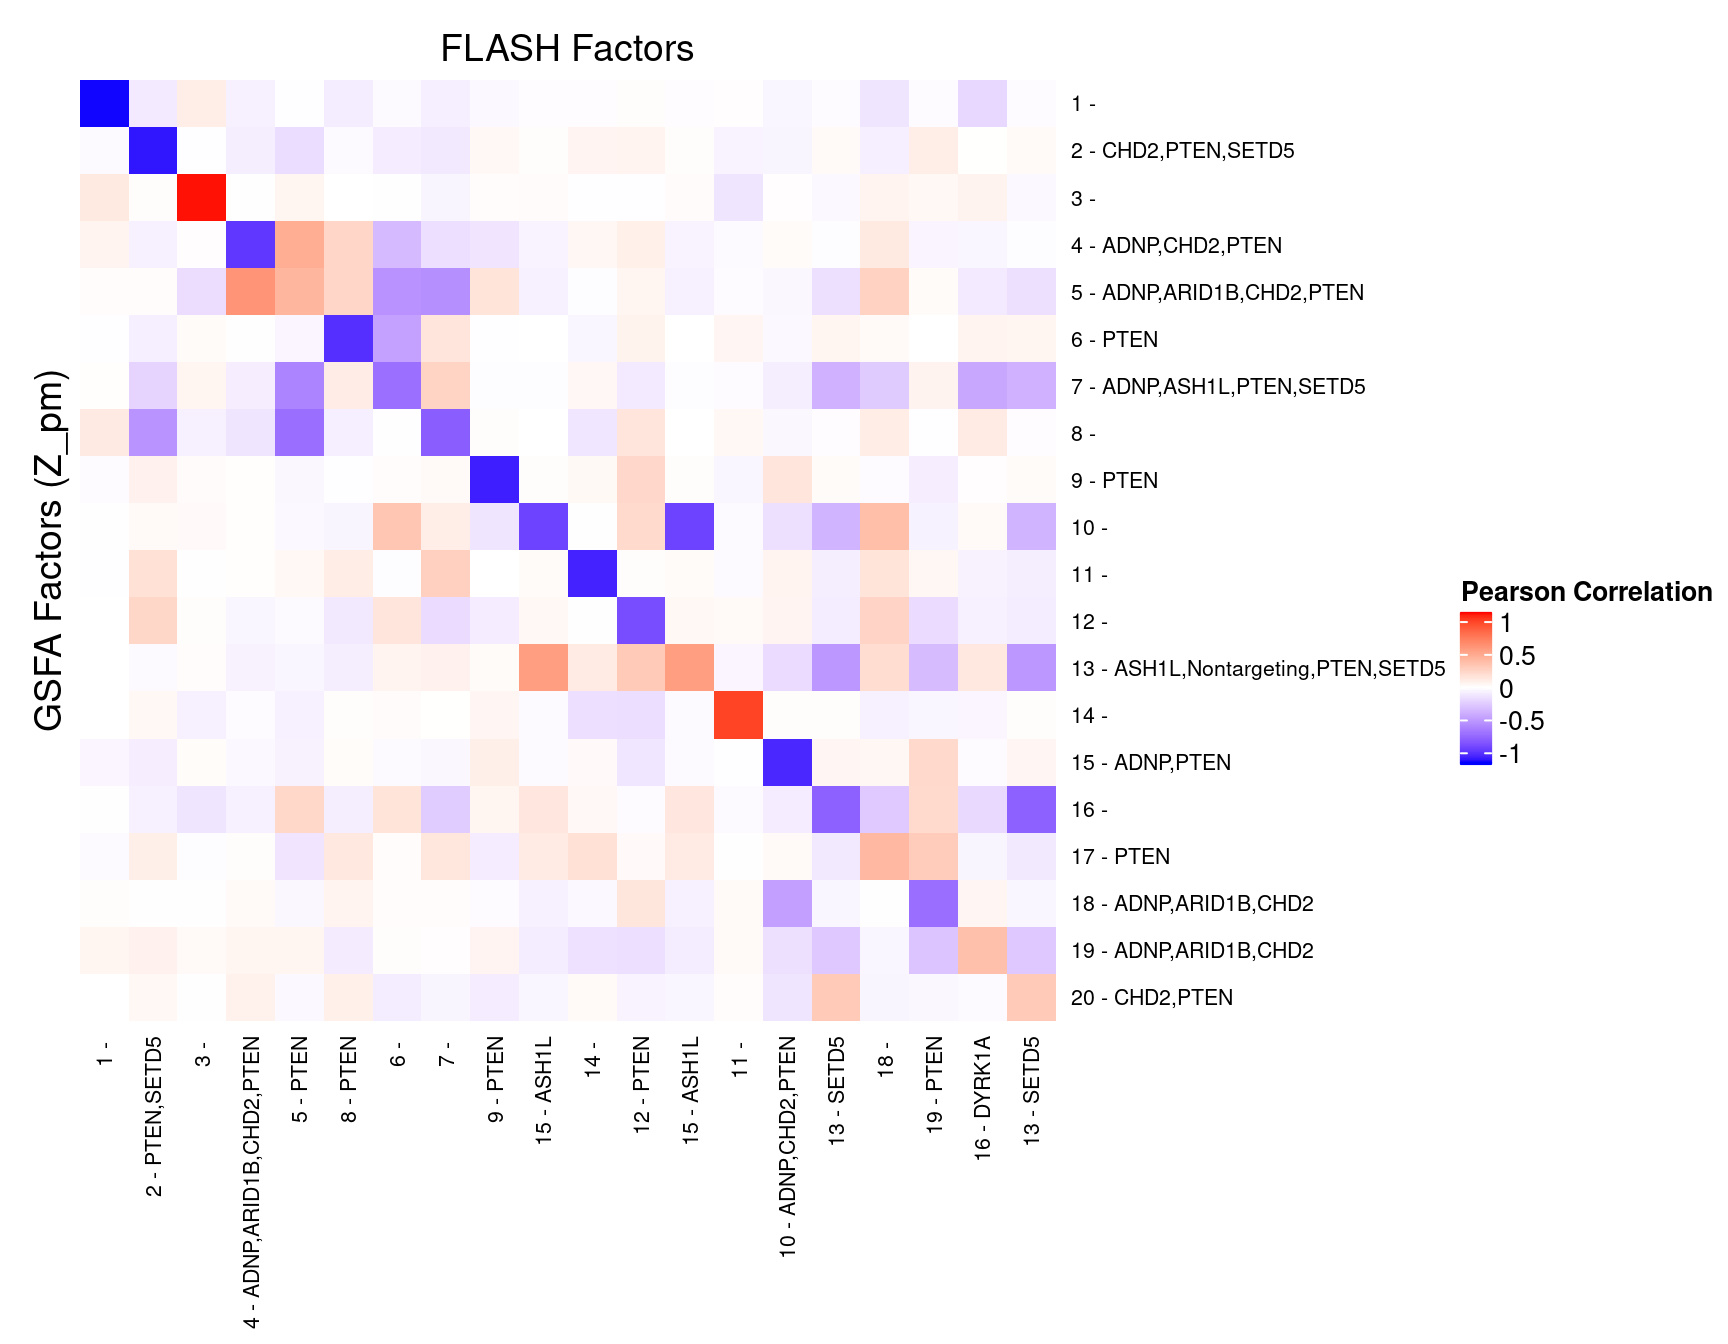
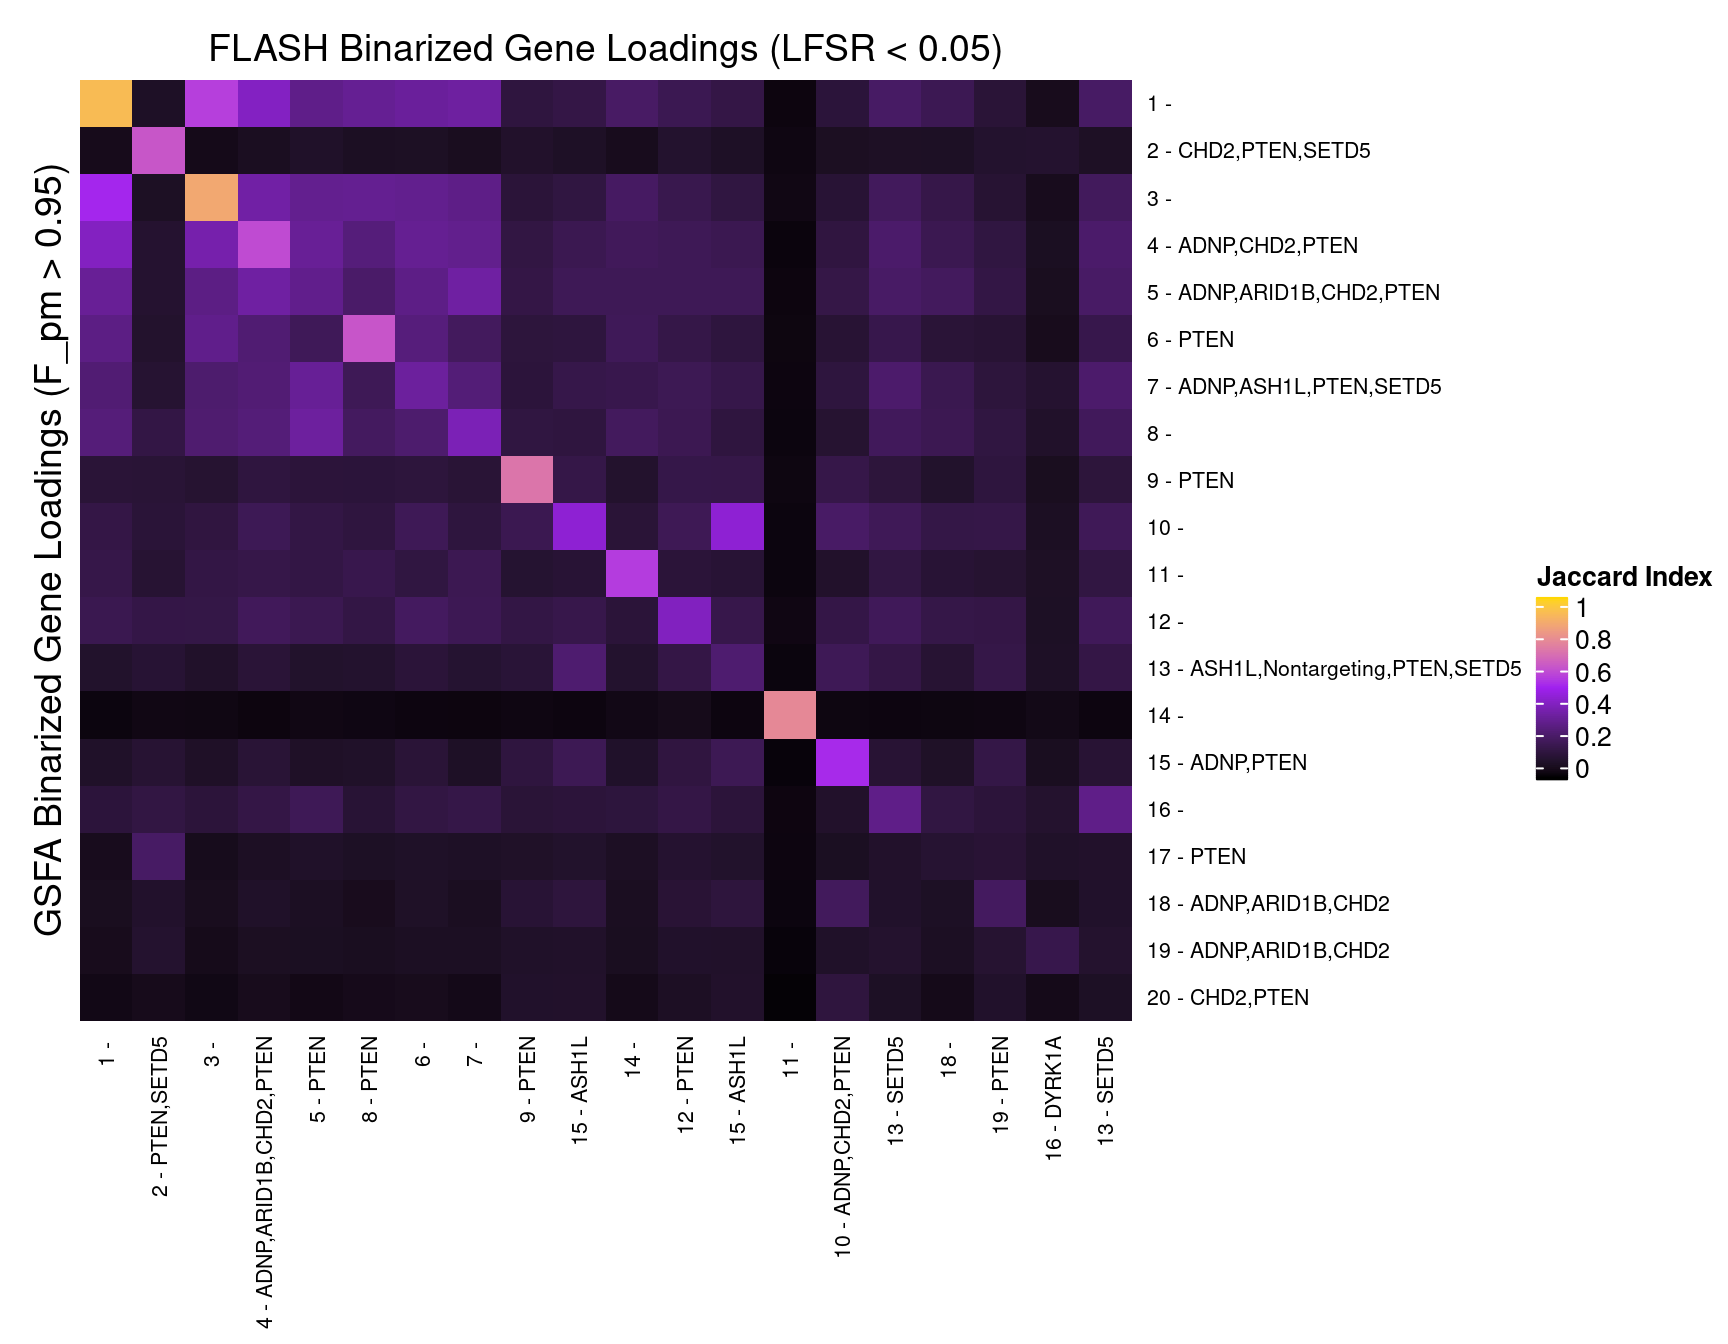
4.2 FLASH vs GSFA
We matched the factors obtained from GFSA with those from FLASH, and conducted pairwise comparisons for both factors and gene loadings.
In the following heatmaps, factors are labeled by the KO condition(s) that they have an association p-value < 1e-4 with.
5 Gene Set Enrichment Analysis
Target genes: Genes w/ non-zero loadings in each factor (PIP cutoff at 0.95);
Backgroud genes: all 6213 genes used in factor analysis;
Statistical test: hypergeometric test (over-representation test);
Only GO terms/pathways that satisfy fold change \(\geq\) 2 and test FDR \(<\) 0.05 are shown below.
5.1 GO Slim Over-Representation Analysis
Gene sets: Gene ontology “Biological Process” (non-redundant).
| GeneSet | description | enrichmentRatio | pValue | FDR | GeneRatio |
|---|---|---|---|---|---|
| GO:0070972 | protein localization to endoplasmic reticulum | 14.715942 | 0.0000000 | 0.0000000 | 82/123 |
| GO:0006413 | translational initiation | 12.434040 | 0.0000000 | 0.0000000 | 89/158 |
| GO:0002181 | cytoplasmic translation | 11.633549 | 0.0000000 | 0.0000000 | 39/74 |
| GO:0090150 | establishment of protein localization to membrane | 8.702216 | 0.0000000 | 0.0000000 | 82/208 |
| GO:0006401 | RNA catabolic process | 7.780150 | 0.0000000 | 0.0000000 | 86/244 |
| GO:0006605 | protein targeting | 6.622174 | 0.0000000 | 0.0000000 | 81/270 |
| GO:1902600 | proton transmembrane transport | 4.810981 | 0.0000000 | 0.0000031 | 17/78 |
| GO:0071826 | ribonucleoprotein complex subunit organization | 4.153693 | 0.0000000 | 0.0000000 | 35/186 |
| GO:0016072 | rRNA metabolic process | 3.511759 | 0.0000000 | 0.0000003 | 28/176 |
| GO:0022613 | ribonucleoprotein complex biogenesis | 3.416201 | 0.0000000 | 0.0000000 | 52/336 |
| GO:0034470 | ncRNA processing | 2.607889 | 0.0000021 | 0.0001404 | 28/237 |
| GO:0009141 | nucleoside triphosphate metabolic process | 2.401825 | 0.0001437 | 0.0075622 | 21/193 |
| GO:0034248 | regulation of cellular amide metabolic process | 2.378654 | 0.0000384 | 0.0023576 | 25/232 |
| GO:0009636 | response to toxic substance | 2.337238 | 0.0006037 | 0.0278085 | 18/170 |
| GO:0009123 | nucleoside monophosphate metabolic process | 2.317761 | 0.0002378 | 0.0116841 | 21/200 |
| GO:0010608 | posttranscriptional regulation of gene expression | 2.169978 | 0.0000507 | 0.0028769 | 29/295 |
| GeneSet | description | enrichmentRatio | pValue | FDR | GeneRatio |
|---|---|---|---|---|---|
| GO:0015844 | monoamine transport | 2.308212 | 0.0003117 | 0.0208834 | 13/17 |
| GeneSet | description | enrichmentRatio | pValue | FDR | GeneRatio |
|---|---|---|---|---|---|
| GO:0090662 | ATP hydrolysis coupled transmembrane transport | 2.457081 | 0.0009878 | 0.0345378 | 11/17 |
| GO:0010257 | NADH dehydrogenase complex assembly | 2.215096 | 0.0000001 | 0.0000132 | 35/60 |
| GO:0070972 | protein localization to endoplasmic reticulum | 2.130197 | 0.0000000 | 0.0000000 | 69/123 |
| GO:0033108 | mitochondrial respiratory chain complex assembly | 2.051419 | 0.0000000 | 0.0000044 | 47/87 |
| GeneSet | description | enrichmentRatio | pValue | FDR | GeneRatio |
|---|---|---|---|---|---|
| GO:0070972 | protein localization to endoplasmic reticulum | 3.008760 | 0.0000000 | 0.0000000 | 96/123 |
| GO:0006413 | translational initiation | 2.513052 | 0.0000000 | 0.0000000 | 103/158 |
| GO:1903513 | endoplasmic reticulum to cytosol transport | 2.386412 | 0.0005341 | 0.0196828 | 13/21 |
| GO:0036260 | RNA capping | 2.372291 | 0.0001327 | 0.0054332 | 16/26 |
| GO:0002181 | cytoplasmic translation | 2.344241 | 0.0000000 | 0.0000000 | 45/74 |
| GO:0090150 | establishment of protein localization to membrane | 2.075755 | 0.0000000 | 0.0000000 | 112/208 |
| GO:1902600 | proton transmembrane transport | 2.075755 | 0.0000001 | 0.0000096 | 42/78 |
| GO:0017004 | cytochrome complex assembly | 2.065164 | 0.0016318 | 0.0400884 | 15/28 |
| GO:0010257 | NADH dehydrogenase complex assembly | 2.055986 | 0.0000050 | 0.0002465 | 32/60 |
| GO:0032527 | protein exit from endoplasmic reticulum | 2.040868 | 0.0006833 | 0.0239810 | 18/34 |
| GO:0006401 | RNA catabolic process | 2.038080 | 0.0000000 | 0.0000000 | 129/244 |
| GeneSet | description | enrichmentRatio | pValue | FDR | GeneRatio |
|---|---|---|---|---|---|
| GO:0070972 | protein localization to endoplasmic reticulum | 2.472091 | 4.00e-07 | 0.0003286 | 33/123 |
| GO:0006413 | translational initiation | 2.041110 | 2.28e-05 | 0.0056108 | 35/158 |
| GeneSet | description | enrichmentRatio | pValue | FDR | GeneRatio |
|---|---|---|---|---|---|
| GO:0035924 | cellular response to vascular endothelial growth factor stimulus | 4.296474 | 0.0009241 | 0.0387893 | 6/10 |
| GO:0048645 | animal organ formation | 3.905885 | 0.0017941 | 0.0473867 | 6/11 |
| GO:0048483 | autonomic nervous system development | 3.855810 | 0.0008017 | 0.0369303 | 7/13 |
| GO:0015844 | monoamine transport | 3.369784 | 0.0010526 | 0.0387893 | 8/17 |
| GO:0021675 | nerve development | 3.113387 | 0.0005418 | 0.0332771 | 10/23 |
| GO:2001023 | regulation of response to drug | 2.963086 | 0.0002656 | 0.0195762 | 12/29 |
| GO:0043583 | ear development | 2.685296 | 0.0000394 | 0.0072662 | 18/48 |
| GO:0002576 | platelet degranulation | 2.515953 | 0.0009652 | 0.0387893 | 13/37 |
| GO:0045165 | cell fate commitment | 2.437716 | 0.0003880 | 0.0259967 | 16/47 |
| GO:0008202 | steroid metabolic process | 2.412875 | 0.0000011 | 0.0002607 | 31/92 |
| GO:0090596 | sensory organ morphogenesis | 2.345776 | 0.0002008 | 0.0185011 | 19/58 |
| GO:0070972 | protein localization to endoplasmic reticulum | 2.270494 | 0.0000003 | 0.0001978 | 39/123 |
| GO:2000027 | regulation of animal organ morphogenesis | 2.254323 | 0.0007250 | 0.0369303 | 17/54 |
| GO:1901615 | organic hydroxy compound metabolic process | 2.164890 | 0.0000011 | 0.0002607 | 39/129 |
| GO:0015850 | organic hydroxy compound transport | 2.161748 | 0.0016990 | 0.0473867 | 16/53 |
| GO:0003007 | heart morphogenesis | 2.045940 | 0.0018003 | 0.0473867 | 18/63 |
| GeneSet | description | enrichmentRatio | pValue | FDR | GeneRatio |
|---|---|---|---|---|---|
| GO:0034453 | microtubule anchoring | 3.133951 | 0.0015751 | 0.0408236 | 8/16 |
| GO:0061842 | microtubule organizing center localization | 3.133951 | 0.0015751 | 0.0408236 | 8/16 |
| GO:0002200 | somatic diversification of immune receptors | 2.872788 | 0.0005354 | 0.0232132 | 11/24 |
| GO:0006338 | chromatin remodeling | 2.537008 | 0.0000000 | 0.0000361 | 34/84 |
| GO:0014074 | response to purine-containing compound | 2.250016 | 0.0018649 | 0.0429519 | 14/39 |
| GO:0030048 | actin filament-based movement | 2.186477 | 0.0018064 | 0.0429466 | 15/43 |
| GO:0032200 | telomere organization | 2.169658 | 0.0000368 | 0.0031555 | 27/78 |
| GO:0006310 | DNA recombination | 2.129869 | 0.0000043 | 0.0007892 | 35/103 |
| GO:0006333 | chromatin assembly or disassembly | 2.117534 | 0.0001118 | 0.0063396 | 25/74 |
| GO:0071103 | DNA conformation change | 2.027850 | 0.0000258 | 0.0031555 | 33/102 |
| GeneSet | description | enrichmentRatio | pValue | FDR | GeneRatio |
|---|---|---|---|---|---|
| GO:0070972 | protein localization to endoplasmic reticulum | 3.389851 | 0.0000000 | 0.0000000 | 68/123 |
| GO:0002065 | columnar/cuboidal epithelial cell differentiation | 2.952272 | 0.0001124 | 0.0118336 | 13/27 |
| GO:0006413 | translational initiation | 2.871782 | 0.0000000 | 0.0000000 | 74/158 |
| GO:0090150 | establishment of protein localization to membrane | 2.505719 | 0.0000000 | 0.0000000 | 85/208 |
| GO:0002181 | cytoplasmic translation | 2.237221 | 0.0000186 | 0.0022818 | 27/74 |
| GO:0006605 | protein targeting | 2.112010 | 0.0000000 | 0.0000000 | 93/270 |
| GeneSet | description | enrichmentRatio | pValue | FDR | GeneRatio |
|---|---|---|---|---|---|
| GO:0010644 | cell communication by electrical coupling | 5.659978 | 0.0002965 | 0.0102778 | 6/13 |
| GO:0046683 | response to organophosphorus | 3.967533 | 0.0000474 | 0.0034922 | 11/34 |
| GO:0060191 | regulation of lipase activity | 3.872616 | 0.0030728 | 0.0415358 | 6/19 |
| GO:0014074 | response to purine-containing compound | 3.773318 | 0.0000377 | 0.0030890 | 12/39 |
| GO:0002576 | platelet degranulation | 3.645841 | 0.0001131 | 0.0060883 | 11/37 |
| GO:0035270 | endocrine system development | 3.449049 | 0.0007511 | 0.0185936 | 9/32 |
| GO:0007422 | peripheral nervous system development | 3.433720 | 0.0030030 | 0.0415358 | 7/25 |
| GO:0046847 | filopodium assembly | 3.301654 | 0.0038268 | 0.0492304 | 7/26 |
| GO:0008277 | regulation of G protein-coupled receptor signaling pathway | 3.199118 | 0.0002217 | 0.0090771 | 12/46 |
| GO:0035418 | protein localization to synapse | 3.153416 | 0.0015176 | 0.0279626 | 9/35 |
| GO:0071241 | cellular response to inorganic substance | 2.978226 | 0.0000309 | 0.0028465 | 17/70 |
| GO:0032103 | positive regulation of response to external stimulus | 2.885479 | 0.0006217 | 0.0163645 | 12/51 |
| GO:0035637 | multicellular organismal signaling | 2.870131 | 0.0010930 | 0.0230158 | 11/47 |
| GO:0045165 | cell fate commitment | 2.870131 | 0.0010930 | 0.0230158 | 11/47 |
| GO:0007159 | leukocyte cell-cell adhesion | 2.829989 | 0.0001682 | 0.0072921 | 15/65 |
| GO:0032409 | regulation of transporter activity | 2.819146 | 0.0000150 | 0.0018428 | 20/87 |
| GO:0010959 | regulation of metal ion transport | 2.803037 | 0.0000023 | 0.0005730 | 24/105 |
| GO:0043270 | positive regulation of ion transport | 2.803037 | 0.0001157 | 0.0060883 | 16/70 |
| GO:0006814 | sodium ion transport | 2.796890 | 0.0005140 | 0.0145707 | 13/57 |
| GO:0034765 | regulation of ion transmembrane transport | 2.791642 | 0.0000004 | 0.0002654 | 28/123 |
| GO:0050920 | regulation of chemotaxis | 2.725174 | 0.0027650 | 0.0412477 | 10/45 |
| GO:0034764 | positive regulation of transmembrane transport | 2.705136 | 0.0002866 | 0.0102778 | 15/68 |
| GO:0010038 | response to metal ion | 2.702080 | 0.0000019 | 0.0005730 | 26/118 |
| GO:1902600 | proton transmembrane transport | 2.672767 | 0.0001335 | 0.0061502 | 17/78 |
| GO:0050803 | regulation of synapse structure or activity | 2.627847 | 0.0001074 | 0.0060883 | 18/84 |
| GO:0060541 | respiratory system development | 2.609210 | 0.0038743 | 0.0492304 | 10/47 |
| GO:0021953 | central nervous system neuron differentiation | 2.581744 | 0.0017689 | 0.0310391 | 12/57 |
| GO:1901654 | response to ketone | 2.494228 | 0.0024118 | 0.0408742 | 12/59 |
| GO:0042391 | regulation of membrane potential | 2.452657 | 0.0000180 | 0.0018969 | 25/125 |
| GO:0010257 | NADH dehydrogenase complex assembly | 2.452657 | 0.0027983 | 0.0412477 | 12/60 |
| GO:0099177 | regulation of trans-synaptic signaling | 2.358324 | 0.0000060 | 0.0011038 | 30/156 |
| GO:0051271 | negative regulation of cellular component movement | 2.353560 | 0.0003220 | 0.0102778 | 19/99 |
| GO:1901342 | regulation of vasculature development | 2.289147 | 0.0025478 | 0.0408742 | 14/75 |
| GO:0090130 | tissue migration | 2.266042 | 0.0010329 | 0.0230158 | 17/92 |
| GO:0060560 | developmental growth involved in morphogenesis | 2.241676 | 0.0011714 | 0.0233327 | 17/93 |
| GO:0001667 | ameboidal-type cell migration | 2.211412 | 0.0002828 | 0.0102778 | 22/122 |
| GO:0002521 | leukocyte differentiation | 2.189872 | 0.0006058 | 0.0163645 | 20/112 |
| GO:0040013 | negative regulation of locomotion | 2.185536 | 0.0011514 | 0.0233327 | 18/101 |
| GO:0001525 | angiogenesis | 2.118204 | 0.0012520 | 0.0242815 | 19/110 |
| GO:0019932 | second-messenger-mediated signaling | 2.109812 | 0.0030997 | 0.0415358 | 16/93 |
| GO:0002009 | morphogenesis of an epithelium | 2.102277 | 0.0003347 | 0.0102778 | 24/140 |
| GO:0061564 | axon development | 2.092314 | 0.0000124 | 0.0018245 | 36/211 |
| GO:0072511 | divalent inorganic cation transport | 2.043881 | 0.0014838 | 0.0279626 | 20/120 |
| GO:0048638 | regulation of developmental growth | 2.043881 | 0.0025227 | 0.0408742 | 18/108 |
| GO:0009141 | nucleoside triphosphate metabolic process | 2.033291 | 0.0000683 | 0.0045787 | 32/193 |
| GO:0050808 | synapse organization | 2.030345 | 0.0004382 | 0.0129185 | 25/151 |
| GeneSet | description | enrichmentRatio | pValue | FDR | GeneRatio |
|---|---|---|---|---|---|
| GO:0015844 | monoamine transport | 5.501393 | 0.0001253 | 0.0046187 | 7/17 |
| GO:0106030 | neuron projection fasciculation | 5.344210 | 0.0045114 | 0.0496258 | 4/10 |
| GO:0034109 | homotypic cell-cell adhesion | 4.922299 | 0.0002847 | 0.0083923 | 7/19 |
| GO:0014812 | muscle cell migration | 3.597065 | 0.0023499 | 0.0320713 | 7/26 |
| GO:0043062 | extracellular structure organization | 3.396744 | 0.0000185 | 0.0013647 | 15/59 |
| GO:0001763 | morphogenesis of a branching structure | 3.340132 | 0.0010241 | 0.0203992 | 9/36 |
| GO:0035270 | endocrine system development | 3.340132 | 0.0019450 | 0.0286696 | 8/32 |
| GO:0055088 | lipid homeostasis | 3.340132 | 0.0037132 | 0.0427598 | 7/28 |
| GO:0098742 | cell-cell adhesion via plasma-membrane adhesion molecules | 3.258665 | 0.0006691 | 0.0149440 | 10/41 |
| GO:2001023 | regulation of response to drug | 3.224955 | 0.0045866 | 0.0497112 | 7/29 |
| GO:0030048 | actin filament-based movement | 3.107099 | 0.0009998 | 0.0203992 | 10/43 |
| GO:0001764 | neuron migration | 3.083198 | 0.0000635 | 0.0029229 | 15/65 |
| GO:0043270 | positive regulation of ion transport | 3.053835 | 0.0000411 | 0.0021620 | 16/70 |
| GO:0009612 | response to mechanical stimulus | 3.025025 | 0.0004144 | 0.0108254 | 12/53 |
| GO:0051271 | negative regulation of cellular component movement | 2.969006 | 0.0000025 | 0.0006055 | 22/99 |
| GO:0003007 | heart morphogenesis | 2.969006 | 0.0001715 | 0.0054946 | 14/63 |
| GO:0032409 | regulation of transporter activity | 2.917816 | 0.0000158 | 0.0012921 | 19/87 |
| GO:0040013 | negative regulation of locomotion | 2.910214 | 0.0000035 | 0.0006468 | 22/101 |
| GO:0090130 | tissue migration | 2.904462 | 0.0000101 | 0.0009337 | 20/92 |
| GO:0035637 | multicellular organismal signaling | 2.842665 | 0.0020623 | 0.0292284 | 10/47 |
| GO:0045165 | cell fate commitment | 2.842665 | 0.0020623 | 0.0292284 | 10/47 |
| GO:0010038 | response to metal ion | 2.830620 | 0.0000013 | 0.0006055 | 25/118 |
| GO:0006814 | sodium ion transport | 2.812742 | 0.0008358 | 0.0175996 | 12/57 |
| GO:0048568 | embryonic organ development | 2.799348 | 0.0000069 | 0.0008471 | 22/105 |
| GO:0061448 | connective tissue development | 2.783443 | 0.0024355 | 0.0326358 | 10/48 |
| GO:0015850 | organic hydroxy compound transport | 2.772939 | 0.0015468 | 0.0242547 | 11/53 |
| GO:0003012 | muscle system process | 2.717395 | 0.0000045 | 0.0006702 | 24/118 |
| GO:0010959 | regulation of metal ion transport | 2.672105 | 0.0000237 | 0.0015907 | 21/105 |
| GO:0031589 | cell-substrate adhesion | 2.672105 | 0.0001423 | 0.0047678 | 17/85 |
| GO:0001667 | ameboidal-type cell migration | 2.628300 | 0.0000083 | 0.0008789 | 24/122 |
| GO:0060560 | developmental growth involved in morphogenesis | 2.585908 | 0.0001418 | 0.0047678 | 18/93 |
| GO:0051056 | regulation of small GTPase mediated signal transduction | 2.578347 | 0.0000274 | 0.0016306 | 22/114 |
| GO:0021953 | central nervous system neuron differentiation | 2.578347 | 0.0028558 | 0.0369252 | 11/57 |
| GO:0061351 | neural precursor cell proliferation | 2.578347 | 0.0028558 | 0.0369252 | 11/57 |
| GO:0034764 | positive regulation of transmembrane transport | 2.554218 | 0.0013341 | 0.0223461 | 13/68 |
| GO:0034330 | cell junction organization | 2.544862 | 0.0000771 | 0.0033413 | 20/105 |
| GO:0001655 | urogenital system development | 2.493965 | 0.0011243 | 0.0212469 | 14/75 |
| GO:0010721 | negative regulation of cell development | 2.490946 | 0.0000477 | 0.0023459 | 22/118 |
| GO:1901654 | response to ketone | 2.490946 | 0.0037842 | 0.0429069 | 11/59 |
| GO:0097305 | response to alcohol | 2.481241 | 0.0017604 | 0.0264776 | 13/70 |
| GO:0019932 | second-messenger-mediated signaling | 2.442247 | 0.0004407 | 0.0108254 | 17/93 |
| GO:0003013 | circulatory system process | 2.429187 | 0.0003222 | 0.0091337 | 18/99 |
| GO:0034765 | regulation of ion transmembrane transport | 2.389688 | 0.0000917 | 0.0037558 | 22/123 |
| GO:0097485 | neuron projection guidance | 2.365927 | 0.0006464 | 0.0148875 | 17/96 |
| GO:0042391 | regulation of membrane potential | 2.351453 | 0.0001176 | 0.0045629 | 22/125 |
| GO:0001525 | angiogenesis | 2.307727 | 0.0004373 | 0.0108254 | 19/110 |
| GO:0001503 | ossification | 2.298585 | 0.0012783 | 0.0223461 | 16/93 |
| GO:0070972 | protein localization to endoplasmic reticulum | 2.281065 | 0.0002606 | 0.0080021 | 21/123 |
| GO:0061564 | axon development | 2.279521 | 0.0000017 | 0.0006055 | 36/211 |
| GO:0050890 | cognition | 2.274132 | 0.0014376 | 0.0230333 | 16/94 |
| GO:0051961 | negative regulation of nervous system development | 2.206325 | 0.0010659 | 0.0206729 | 18/109 |
| GO:0007389 | pattern specification process | 2.186268 | 0.0011889 | 0.0219053 | 18/110 |
| GO:0022604 | regulation of cell morphogenesis | 2.157168 | 0.0000288 | 0.0016306 | 31/192 |
| GO:0050808 | synapse organization | 2.035047 | 0.0007381 | 0.0159993 | 23/151 |
| GO:0090066 | regulation of anatomical structure size | 2.007940 | 0.0004178 | 0.0108254 | 26/173 |
| GeneSet | description | enrichmentRatio | pValue | FDR | GeneRatio |
|---|---|---|---|---|---|
| GO:0042558 | pteridine-containing compound metabolic process | 4.570345 | 0.0002369 | 0.0093214 | 7/12 |
| GO:0051156 | glucose 6-phosphate metabolic process | 4.273569 | 0.0011054 | 0.0271548 | 6/11 |
| GO:0070670 | response to interleukin-4 | 4.273569 | 0.0011054 | 0.0271548 | 6/11 |
| GO:0051187 | cofactor catabolic process | 3.482167 | 0.0009100 | 0.0239536 | 8/18 |
| GO:0006081 | cellular aldehyde metabolic process | 3.191987 | 0.0002530 | 0.0093214 | 11/27 |
| GO:0072524 | pyridine-containing compound metabolic process | 2.651804 | 0.0000085 | 0.0006022 | 22/65 |
| GO:0009123 | nucleoside monophosphate metabolic process | 2.624684 | 0.0000000 | 0.0000000 | 67/200 |
| GO:0099132 | ATP hydrolysis coupled cation transmembrane transport | 2.611626 | 0.0018242 | 0.0388436 | 11/33 |
| GO:0046939 | nucleotide phosphorylation | 2.554851 | 0.0003708 | 0.0109672 | 15/46 |
| GO:0046390 | ribose phosphate biosynthetic process | 2.550890 | 0.0000000 | 0.0000004 | 42/129 |
| GO:0072522 | purine-containing compound biosynthetic process | 2.531268 | 0.0000000 | 0.0000004 | 42/130 |
| GO:0009141 | nucleoside triphosphate metabolic process | 2.516903 | 0.0000000 | 0.0000000 | 62/193 |
| GO:0070972 | protein localization to endoplasmic reticulum | 2.484229 | 0.0000000 | 0.0000024 | 39/123 |
| GO:0006090 | pyruvate metabolic process | 2.458000 | 0.0003912 | 0.0110879 | 16/51 |
| GO:1902600 | proton transmembrane transport | 2.410731 | 0.0000211 | 0.0011110 | 24/78 |
| GO:0014074 | response to purine-containing compound | 2.410731 | 0.0024825 | 0.0457408 | 12/39 |
| GO:0002181 | cytoplasmic translation | 2.223411 | 0.0002477 | 0.0093214 | 21/74 |
| GO:0009259 | ribonucleotide metabolic process | 2.217418 | 0.0000000 | 0.0000000 | 75/265 |
| GO:1901293 | nucleoside phosphate biosynthetic process | 2.181864 | 0.0000002 | 0.0000189 | 44/158 |
| GO:0016999 | antibiotic metabolic process | 2.161345 | 0.0018447 | 0.0388436 | 16/58 |
| GO:0009132 | nucleoside diphosphate metabolic process | 2.136785 | 0.0028661 | 0.0491240 | 15/55 |
| GO:0006413 | translational initiation | 2.132277 | 0.0000006 | 0.0000467 | 43/158 |
| GO:0006091 | generation of precursor metabolites and energy | 2.131086 | 0.0000000 | 0.0000000 | 68/250 |
| GO:0010257 | NADH dehydrogenase complex assembly | 2.089300 | 0.0027016 | 0.0485626 | 16/60 |
| GO:1901615 | organic hydroxy compound metabolic process | 2.004271 | 0.0000482 | 0.0023678 | 33/129 |
| GeneSet | description | enrichmentRatio | pValue | FDR | GeneRatio |
|---|---|---|---|---|---|
| GO:0006413 | translational initiation | 6.550170 | 0.0000000 | 0.0000000 | 53/158 |
| GO:0070972 | protein localization to endoplasmic reticulum | 6.508974 | 0.0000000 | 0.0000000 | 41/123 |
| GO:0002181 | cytoplasmic translation | 6.333056 | 0.0000000 | 0.0000000 | 24/74 |
| GO:0034109 | homotypic cell-cell adhesion | 6.166397 | 0.0002625 | 0.0161240 | 6/19 |
| GO:1902600 | proton transmembrane transport | 4.756558 | 0.0000000 | 0.0000007 | 19/78 |
| GO:0090150 | establishment of protein localization to membrane | 4.130695 | 0.0000000 | 0.0000000 | 44/208 |
| GO:0006401 | RNA catabolic process | 4.001419 | 0.0000000 | 0.0000000 | 50/244 |
| GO:0006605 | protein targeting | 3.326809 | 0.0000000 | 0.0000000 | 46/270 |
| GO:0010257 | NADH dehydrogenase complex assembly | 3.254487 | 0.0008106 | 0.0398268 | 10/60 |
| GO:0009141 | nucleoside triphosphate metabolic process | 2.934097 | 0.0000001 | 0.0000096 | 29/193 |
| GO:0009123 | nucleoside monophosphate metabolic process | 2.733769 | 0.0000008 | 0.0000645 | 28/200 |
| GO:0006091 | generation of precursor metabolites and energy | 2.343231 | 0.0000083 | 0.0006087 | 30/250 |
| GO:0009636 | response to toxic substance | 2.297285 | 0.0003725 | 0.0211170 | 20/170 |
| GO:0009259 | ribonucleotide metabolic process | 2.210595 | 0.0000263 | 0.0017637 | 30/265 |
| GO:0071826 | ribonucleoprotein complex subunit organization | 2.204653 | 0.0004685 | 0.0246629 | 21/186 |
| GeneSet | description | enrichmentRatio | pValue | FDR | GeneRatio |
|---|---|---|---|---|---|
| GO:0048483 | autonomic nervous system development | 8.710895 | 0.0000262 | 0.0016095 | 6/13 |
| GO:0014075 | response to amine | 8.578912 | 0.0001428 | 0.0037591 | 5/11 |
| GO:0050886 | endocrine process | 7.259079 | 0.0003643 | 0.0078973 | 5/13 |
| GO:0010737 | protein kinase A signaling | 6.863129 | 0.0018914 | 0.0225976 | 4/11 |
| GO:0021953 | central nervous system neuron differentiation | 5.960086 | 0.0000000 | 0.0000002 | 18/57 |
| GO:0021675 | nerve development | 5.744141 | 0.0001277 | 0.0036187 | 7/23 |
| GO:0015844 | monoamine transport | 5.551061 | 0.0014700 | 0.0193462 | 5/17 |
| GO:0048706 | embryonic skeletal system development | 5.392459 | 0.0000688 | 0.0028606 | 8/28 |
| GO:0097366 | response to bronchodilator | 5.392459 | 0.0050566 | 0.0465839 | 4/14 |
| GO:0006959 | humoral immune response | 5.284610 | 0.0002284 | 0.0052607 | 7/25 |
| GO:1904888 | cranial skeletal system development | 5.242668 | 0.0019484 | 0.0225976 | 5/18 |
| GO:2001023 | regulation of response to drug | 5.206512 | 0.0000906 | 0.0030365 | 8/29 |
| GO:0021510 | spinal cord development | 4.853213 | 0.0000601 | 0.0027696 | 9/35 |
| GO:0001655 | urogenital system development | 4.781314 | 0.0000000 | 0.0000015 | 19/75 |
| GO:0001763 | morphogenesis of a branching structure | 4.718401 | 0.0000765 | 0.0028606 | 9/36 |
| GO:0015837 | amine transport | 4.718401 | 0.0032312 | 0.0329662 | 5/20 |
| GO:0038179 | neurotrophin signaling pathway | 4.493716 | 0.0040603 | 0.0383650 | 5/21 |
| GO:0042982 | amyloid precursor protein metabolic process | 4.355448 | 0.0019599 | 0.0225976 | 6/26 |
| GO:0031644 | regulation of neurological system process | 4.261782 | 0.0009502 | 0.0142914 | 7/31 |
| GO:0035270 | endocrine system development | 4.128601 | 0.0011621 | 0.0161597 | 7/32 |
| GO:0043270 | positive regulation of ion transport | 4.044344 | 0.0000026 | 0.0003134 | 15/70 |
| GO:0097305 | response to alcohol | 4.044344 | 0.0000026 | 0.0003134 | 15/70 |
| GO:0003007 | heart morphogenesis | 3.894554 | 0.0000187 | 0.0013384 | 13/63 |
| GO:0046683 | response to organophosphorus | 3.885742 | 0.0016959 | 0.0215499 | 7/34 |
| GO:0014074 | response to purine-containing compound | 3.871509 | 0.0008182 | 0.0128295 | 8/39 |
| GO:0035418 | protein localization to synapse | 3.774721 | 0.0020258 | 0.0226213 | 7/35 |
| GO:0015893 | drug transport | 3.692662 | 0.0005612 | 0.0100885 | 9/46 |
| GO:0042445 | hormone metabolic process | 3.669868 | 0.0024032 | 0.0256691 | 7/36 |
| GO:0003205 | cardiac chamber development | 3.614095 | 0.0006626 | 0.0110980 | 9/47 |
| GO:0045165 | cell fate commitment | 3.614095 | 0.0006626 | 0.0110980 | 9/47 |
| GO:2000027 | regulation of animal organ morphogenesis | 3.495112 | 0.0004436 | 0.0090807 | 10/54 |
| GO:0060560 | developmental growth involved in morphogenesis | 3.450014 | 0.0000055 | 0.0005837 | 17/93 |
| GO:0035148 | tube formation | 3.431565 | 0.0005173 | 0.0095308 | 10/55 |
| GO:0034764 | positive regulation of transmembrane transport | 3.330636 | 0.0001940 | 0.0047662 | 12/68 |
| GO:0030902 | hindbrain development | 3.254070 | 0.0008017 | 0.0128295 | 10/58 |
| GO:0090596 | sensory organ morphogenesis | 3.254070 | 0.0008017 | 0.0128295 | 10/58 |
| GO:0060541 | respiratory system development | 3.212529 | 0.0028944 | 0.0300450 | 8/47 |
| GO:0015850 | organic hydroxy compound transport | 3.204952 | 0.0016303 | 0.0210791 | 9/53 |
| GO:0043583 | ear development | 3.145601 | 0.0033176 | 0.0329662 | 8/48 |
| GO:0060485 | mesenchyme development | 3.102511 | 0.0003863 | 0.0081354 | 12/73 |
| GO:0048705 | skeletal system morphogenesis | 3.081405 | 0.0037874 | 0.0362508 | 8/49 |
| GO:0061564 | axon development | 3.041245 | 0.0000000 | 0.0000010 | 34/211 |
| GO:0050673 | epithelial cell proliferation | 2.980043 | 0.0001175 | 0.0036095 | 15/95 |
| GO:0046677 | response to antibiotic | 2.915435 | 0.0000200 | 0.0013384 | 19/123 |
| GO:0009636 | response to toxic substance | 2.886551 | 0.0000007 | 0.0001257 | 26/170 |
| GO:0010038 | response to metal ion | 2.879025 | 0.0000395 | 0.0019838 | 18/118 |
| GO:0010721 | negative regulation of cell development | 2.879025 | 0.0000395 | 0.0019838 | 18/118 |
| GO:0048568 | embryonic organ development | 2.875978 | 0.0001080 | 0.0034611 | 16/105 |
| GO:0030900 | forebrain development | 2.872070 | 0.0000092 | 0.0008473 | 21/138 |
| GO:0060537 | muscle tissue development | 2.839392 | 0.0000776 | 0.0028606 | 17/113 |
| GO:0048880 | sensory system development | 2.831041 | 0.0002123 | 0.0050473 | 15/100 |
| GO:0007517 | muscle organ development | 2.822221 | 0.0001359 | 0.0037092 | 16/107 |
| GO:0051961 | negative regulation of nervous system development | 2.770438 | 0.0001698 | 0.0043164 | 16/109 |
| GO:0097485 | neuron projection guidance | 2.752401 | 0.0004637 | 0.0092359 | 14/96 |
| GO:0048732 | gland development | 2.739717 | 0.0000774 | 0.0028606 | 18/124 |
| GO:0021915 | neural tube development | 2.739717 | 0.0049195 | 0.0458947 | 9/62 |
| GO:0001503 | ossification | 2.638246 | 0.0011078 | 0.0157666 | 13/93 |
| GO:0048638 | regulation of developmental growth | 2.621334 | 0.0005004 | 0.0095308 | 15/108 |
| GO:0050890 | cognition | 2.610180 | 0.0012260 | 0.0167324 | 13/94 |
| GO:0050769 | positive regulation of neurogenesis | 2.603256 | 0.0000119 | 0.0009735 | 24/174 |
| GO:0032409 | regulation of transporter activity | 2.603256 | 0.0019211 | 0.0225976 | 12/87 |
| GO:0002009 | morphogenesis of an epithelium | 2.561418 | 0.0001241 | 0.0036187 | 19/140 |
| GO:0042063 | gliogenesis | 2.544756 | 0.0023394 | 0.0253550 | 12/89 |
| GO:0042692 | muscle cell differentiation | 2.483369 | 0.0008938 | 0.0137241 | 15/114 |
| GO:0002683 | negative regulation of immune system process | 2.435304 | 0.0033995 | 0.0329662 | 12/93 |
| GO:0019932 | second-messenger-mediated signaling | 2.435304 | 0.0033995 | 0.0329662 | 12/93 |
| GO:0016049 | cell growth | 2.422281 | 0.0000404 | 0.0019838 | 24/187 |
| GO:0007389 | pattern specification process | 2.402095 | 0.0018265 | 0.0225976 | 14/110 |
| GO:0003012 | muscle system process | 2.399187 | 0.0012815 | 0.0171723 | 15/118 |
| GO:0007568 | aging | 2.380455 | 0.0019930 | 0.0225976 | 14/111 |
| GO:0035690 | cellular response to drug | 2.380455 | 0.0019930 | 0.0225976 | 14/111 |
| GO:0048545 | response to steroid hormone | 2.377777 | 0.0009809 | 0.0144590 | 16/127 |
| GO:0050808 | synapse organization | 2.374825 | 0.0003389 | 0.0075695 | 19/151 |
| GO:0010959 | regulation of metal ion transport | 2.336732 | 0.0033732 | 0.0329662 | 13/105 |
| GO:0099177 | regulation of trans-synaptic signaling | 2.298708 | 0.0005146 | 0.0095308 | 19/156 |
| GO:0010975 | regulation of neuron projection development | 2.268462 | 0.0000840 | 0.0029492 | 25/208 |
| GO:0051098 | regulation of binding | 2.220424 | 0.0005799 | 0.0101753 | 20/170 |
| GO:0031346 | positive regulation of cell projection organization | 2.160232 | 0.0011124 | 0.0157666 | 19/166 |
| GO:0034765 | regulation of ion transmembrane transport | 2.148215 | 0.0051731 | 0.0470689 | 14/123 |
| GO:0070997 | neuron death | 2.110864 | 0.0025855 | 0.0272219 | 17/152 |
| GO:0071900 | regulation of protein serine/threonine kinase activity | 2.037492 | 0.0022262 | 0.0244877 | 19/176 |
| GeneSet | description | enrichmentRatio | pValue | FDR | GeneRatio |
|---|---|---|---|---|---|
| GO:0001655 | urogenital system development | 3.709224 | 0.0000721 | 0.0268350 | 12/75 |
| GO:0006413 | translational initiation | 2.641061 | 0.0001316 | 0.0323235 | 18/158 |
| GO:0090150 | establishment of protein localization to membrane | 2.452011 | 0.0000728 | 0.0268350 | 22/208 |
| GO:0061564 | axon development | 2.307278 | 0.0002538 | 0.0467578 | 21/211 |
| GeneSet | description | enrichmentRatio | pValue | FDR | GeneRatio |
|---|---|---|---|---|---|
| GO:0042116 | macrophage activation | 12.692500 | 0.0000035 | 0.0019767 | 6/15 |
| GO:0050918 | positive chemotaxis | 12.692500 | 0.0001720 | 0.0138834 | 4/10 |
| GO:0014075 | response to amine | 11.538636 | 0.0002637 | 0.0138834 | 4/11 |
| GO:0050919 | negative chemotaxis | 11.538636 | 0.0002637 | 0.0138834 | 4/11 |
| GO:0048483 | autonomic nervous system development | 9.763462 | 0.0005438 | 0.0169411 | 4/13 |
| GO:0035924 | cellular response to vascular endothelial growth factor stimulus | 9.519375 | 0.0031313 | 0.0461551 | 3/10 |
| GO:0015844 | monoamine transport | 9.332721 | 0.0001329 | 0.0138834 | 5/17 |
| GO:0097366 | response to bronchodilator | 9.066071 | 0.0007428 | 0.0188770 | 4/14 |
| GO:0021675 | nerve development | 6.898098 | 0.0006200 | 0.0169411 | 5/23 |
| GO:0015837 | amine transport | 6.346250 | 0.0031015 | 0.0461551 | 4/20 |
| GO:0021953 | central nervous system neuron differentiation | 5.566886 | 0.0000088 | 0.0021578 | 10/57 |
| GO:2001023 | regulation of response to drug | 5.470905 | 0.0018781 | 0.0345845 | 5/29 |
| GO:0035270 | endocrine system development | 4.958008 | 0.0029512 | 0.0453129 | 5/32 |
| GO:0050920 | regulation of chemotaxis | 4.935972 | 0.0004479 | 0.0165056 | 7/45 |
| GO:0008277 | regulation of G protein-coupled receptor signaling pathway | 4.828669 | 0.0005145 | 0.0169411 | 7/46 |
| GO:0009612 | response to mechanical stimulus | 4.789623 | 0.0002163 | 0.0138834 | 8/53 |
| GO:0045165 | cell fate commitment | 4.725931 | 0.0005888 | 0.0169411 | 7/47 |
| GO:0061351 | neural precursor cell proliferation | 4.453509 | 0.0003624 | 0.0155891 | 8/57 |
| GO:0032103 | positive regulation of response to external stimulus | 4.355270 | 0.0009752 | 0.0224600 | 7/51 |
| GO:0015850 | organic hydroxy compound transport | 4.190920 | 0.0012316 | 0.0259348 | 7/53 |
| GO:0015893 | drug transport | 4.138859 | 0.0029407 | 0.0453129 | 6/46 |
| GO:0043270 | positive regulation of ion transport | 4.079732 | 0.0003062 | 0.0150465 | 9/70 |
| GO:0003205 | cardiac chamber development | 4.050798 | 0.0032849 | 0.0474698 | 6/47 |
| GO:0003007 | heart morphogenesis | 4.029365 | 0.0007236 | 0.0188770 | 8/63 |
| GO:0019932 | second-messenger-mediated signaling | 3.753159 | 0.0001409 | 0.0138834 | 11/93 |
| GO:0050890 | cognition | 3.713231 | 0.0001553 | 0.0138834 | 11/94 |
| GO:0030900 | forebrain development | 3.678986 | 0.0000054 | 0.0019767 | 16/138 |
| GO:0032409 | regulation of transporter activity | 3.647270 | 0.0003606 | 0.0155891 | 10/87 |
| GO:0006836 | neurotransmitter transport | 3.525694 | 0.0002474 | 0.0138834 | 11/99 |
| GO:0070371 | ERK1 and ERK2 cascade | 3.525694 | 0.0033977 | 0.0481553 | 7/63 |
| GO:0060485 | mesenchyme development | 3.477397 | 0.0019240 | 0.0345845 | 8/73 |
| GO:0060560 | developmental growth involved in morphogenesis | 3.411962 | 0.0006190 | 0.0169411 | 10/93 |
| GO:0050803 | regulation of synapse structure or activity | 3.399777 | 0.0011895 | 0.0257844 | 9/84 |
| GO:0001655 | urogenital system development | 3.384667 | 0.0022896 | 0.0383512 | 8/75 |
| GO:0009410 | response to xenobiotic stimulus | 3.254487 | 0.0029381 | 0.0453129 | 8/78 |
| GO:0099504 | synaptic vesicle cycle | 3.208778 | 0.0017958 | 0.0345845 | 9/89 |
| GO:0007389 | pattern specification process | 3.173125 | 0.0006206 | 0.0169411 | 11/110 |
| GO:0051235 | maintenance of location | 3.173125 | 0.0006206 | 0.0169411 | 11/110 |
| GO:0001505 | regulation of neurotransmitter levels | 3.121107 | 0.0004092 | 0.0158736 | 12/122 |
| GO:0031098 | stress-activated protein kinase signaling cascade | 3.022024 | 0.0015980 | 0.0318312 | 10/105 |
| GO:0023061 | signal release | 2.993514 | 0.0001235 | 0.0138834 | 15/159 |
| GO:0050808 | synapse organization | 2.941970 | 0.0002515 | 0.0138834 | 14/151 |
| GO:0032147 | activation of protein kinase activity | 2.911124 | 0.0021200 | 0.0372014 | 10/109 |
| GO:0072511 | divalent inorganic cation transport | 2.908698 | 0.0012879 | 0.0263666 | 11/120 |
| GO:0072507 | divalent inorganic cation homeostasis | 2.884659 | 0.0022700 | 0.0383512 | 10/110 |
| GO:0061564 | axon development | 2.857316 | 0.0000286 | 0.0052617 | 19/211 |
| GO:0061458 | reproductive system development | 2.770189 | 0.0019158 | 0.0345845 | 11/126 |
| GO:0071900 | regulation of protein serine/threonine kinase activity | 2.704368 | 0.0003807 | 0.0155891 | 15/176 |
| GO:0099177 | regulation of trans-synaptic signaling | 2.644271 | 0.0011606 | 0.0257844 | 13/156 |
| GO:0009636 | response to toxic substance | 2.613162 | 0.0008441 | 0.0207362 | 14/170 |
| GO:0042326 | negative regulation of phosphorylation | 2.582776 | 0.0009475 | 0.0224600 | 14/172 |
| GO:0022604 | regulation of cell morphogenesis | 2.313737 | 0.0027111 | 0.0444022 | 14/192 |
| Factor | 1 | 2 | 3 | 4 | 5 | 6 | 7 | 8 | 9 | 10 |
| Signif_GO_terms | 0 | 16 | 0 | 0 | 1 | 0 | 4 | 11 | 2 | 16 |
| Factor | 11 | 12 | 13 | 14 | 15 | 16 | 17 | 18 | 19 | 20 |
| Signif_GO_terms | 10 | 6 | 46 | 0 | 55 | 25 | 15 | 81 | 4 | 52 |
5.1.1 Factors of interest
10: (nerve development, cell fate commitment);
11: chromatin remodeling, DNA recombination;
13: regulation of metal ion transport, axon development, …;
15: neuron migration, response to metal ion, CNS neuron development, …;
18: CNS neuron differentiation, xxx tissue development, …;
19: axon development;
20: nerve development, neurotransmitter transport, ….
5.2 Reactome Pathway Over-Representation Analysis
Gene sets: The Reactome pathway database.
| GeneSet | description | enrichmentRatio | pValue | FDR | GeneRatio |
|---|---|---|---|---|---|
| R-HSA-156902 | Peptide chain elongation | 16.822537 | 0.0000000 | 0.0000000 | 79/84 |
| R-HSA-156842 | Eukaryotic Translation Elongation | 16.653651 | 0.0000000 | 0.0000000 | 81/87 |
| R-HSA-192823 | Viral mRNA Translation | 16.594200 | 0.0000000 | 0.0000000 | 77/83 |
| R-HSA-2408557 | Selenocysteine synthesis | 16.203749 | 0.0000000 | 0.0000000 | 77/85 |
| R-HSA-72764 | Eukaryotic Translation Termination | 16.015333 | 0.0000000 | 0.0000000 | 77/86 |
| R-HSA-975956 | Nonsense Mediated Decay (NMD) independent of the Exon Junction Complex (EJC) | 15.854612 | 0.0000000 | 0.0000000 | 78/88 |
| R-HSA-72689 | Formation of a pool of free 40S subunits | 15.816099 | 0.0000000 | 0.0000000 | 84/95 |
| R-HSA-156827 | L13a-mediated translational silencing of Ceruloplasmin expression | 14.820868 | 0.0000000 | 0.0000000 | 87/105 |
| R-HSA-72706 | GTP hydrolysis and joining of the 60S ribosomal subunit | 14.681049 | 0.0000000 | 0.0000000 | 87/106 |
| R-HSA-2408522 | Selenoamino acid metabolism | 14.092989 | 0.0000000 | 0.0000000 | 78/99 |
| R-HSA-72613 | Eukaryotic Translation Initiation | 13.929898 | 0.0000000 | 0.0000000 | 88/113 |
| R-HSA-72737 | Cap-dependent Translation Initiation | 13.929898 | 0.0000000 | 0.0000000 | 88/113 |
| R-HSA-72695 | Formation of the ternary complex, and subsequently, the 43S complex | 13.788092 | 0.0000000 | 0.0000000 | 37/48 |
| R-HSA-1799339 | SRP-dependent cotranslational protein targeting to membrane | 13.458030 | 0.0000000 | 0.0000000 | 79/105 |
| R-HSA-927802 | Nonsense-Mediated Decay (NMD) | 13.287675 | 0.0000000 | 0.0000000 | 78/105 |
| R-HSA-975957 | Nonsense Mediated Decay (NMD) enhanced by the Exon Junction Complex (EJC) | 13.287675 | 0.0000000 | 0.0000000 | 78/105 |
| R-HSA-72649 | Translation initiation complex formation | 13.008913 | 0.0000000 | 0.0000000 | 40/55 |
| R-HSA-72702 | Ribosomal scanning and start codon recognition | 13.008913 | 0.0000000 | 0.0000000 | 40/55 |
| R-HSA-72662 | Activation of the mRNA upon binding of the cap-binding complex and eIFs, and subsequent binding to 43S | 12.776611 | 0.0000000 | 0.0000000 | 40/56 |
| R-HSA-168273 | Influenza Viral RNA Transcription and Replication | 11.771954 | 0.0000000 | 0.0000000 | 77/117 |
| R-HSA-168255 | Influenza Life Cycle | 11.161647 | 0.0000000 | 0.0000000 | 78/125 |
| R-HSA-168254 | Influenza Infection | 10.624760 | 0.0000000 | 0.0000000 | 79/133 |
| R-HSA-9010553 | Regulation of expression of SLITs and ROBOs | 9.603895 | 0.0000000 | 0.0000000 | 80/149 |
| R-HSA-8876725 | Protein methylation | 8.943627 | 0.0000198 | 0.0005040 | 6/12 |
| R-HSA-6791226 | Major pathway of rRNA processing in the nucleolus and cytosol | 8.886662 | 0.0000000 | 0.0000000 | 78/157 |
| R-HSA-8868773 | rRNA processing in the nucleus and cytosol | 8.559545 | 0.0000000 | 0.0000000 | 78/163 |
| R-HSA-72312 | rRNA processing | 8.354526 | 0.0000000 | 0.0000000 | 78/167 |
| R-HSA-376176 | Signaling by ROBO receptors | 7.994304 | 0.0000000 | 0.0000000 | 80/179 |
| R-HSA-2514856 | The phototransduction cascade | 7.154902 | 0.0015257 | 0.0330685 | 4/10 |
| R-HSA-2514859 | Inactivation, recovery and regulation of the phototransduction cascade | 7.154902 | 0.0015257 | 0.0330685 | 4/10 |
| R-HSA-71291 | Metabolism of amino acids and derivatives | 6.749907 | 0.0000000 | 0.0000000 | 80/212 |
| R-HSA-72766 | Translation | 6.560962 | 0.0000000 | 0.0000000 | 95/259 |
| R-HSA-8982491 | Glycogen metabolism | 6.388305 | 0.0006875 | 0.0156870 | 5/14 |
| R-HSA-5626467 | RHO GTPases activate IQGAPs | 5.962418 | 0.0002989 | 0.0070741 | 6/18 |
| R-HSA-5663205 | Infectious disease | 5.668496 | 0.0000000 | 0.0000000 | 90/284 |
| R-HSA-5339562 | Uptake and actions of bacterial toxins | 5.260957 | 0.0018512 | 0.0391458 | 5/17 |
| R-HSA-163210 | Formation of ATP by chemiosmotic coupling | 4.968682 | 0.0024482 | 0.0493631 | 5/18 |
| R-HSA-422475 | Axon guidance | 4.730064 | 0.0000000 | 0.0000000 | 87/329 |
| R-HSA-1266738 | Developmental Biology | 3.698039 | 0.0000000 | 0.0000000 | 92/445 |
| R-HSA-1643685 | Disease | 3.472891 | 0.0000000 | 0.0000000 | 93/479 |
| R-HSA-163200 | Respiratory electron transport, ATP synthesis by chemiosmotic coupling, and heat production by uncoupling proteins. | 2.824303 | 0.0000453 | 0.0011231 | 18/114 |
| R-HSA-611105 | Respiratory electron transport | 2.447730 | 0.0021058 | 0.0434700 | 13/95 |
| R-HSA-1428517 | The citric acid (TCA) cycle and respiratory electron transport | 2.376628 | 0.0003019 | 0.0070741 | 19/143 |
| GeneSet | description | enrichmentRatio | pValue | FDR | GeneRatio |
|---|---|---|---|---|---|
| R-HSA-5601884 | PIWI-interacting RNA (piRNA) biogenesis | 2.295113 | 0.0016976 | 0.0358973 | 10/13 |
| R-HSA-445355 | Smooth Muscle Contraction | 2.281612 | 0.0003521 | 0.0080343 | 13/17 |
| R-HSA-156902 | Peptide chain elongation | 2.131176 | 0.0000000 | 0.0000000 | 60/84 |
| R-HSA-156842 | Eukaryotic Translation Elongation | 2.126277 | 0.0000000 | 0.0000000 | 62/87 |
| R-HSA-192823 | Viral mRNA Translation | 2.084958 | 0.0000000 | 0.0000000 | 58/83 |
| R-HSA-72662 | Activation of the mRNA upon binding of the cap-binding complex and eIFs, and subsequent binding to 43S | 2.077897 | 0.0000000 | 0.0000010 | 39/56 |
| R-HSA-72649 | Translation initiation complex formation | 2.061429 | 0.0000001 | 0.0000019 | 38/55 |
| R-HSA-72702 | Ribosomal scanning and start codon recognition | 2.061429 | 0.0000001 | 0.0000019 | 38/55 |
| R-HSA-72706 | GTP hydrolysis and joining of the 60S ribosomal subunit | 2.054776 | 0.0000000 | 0.0000000 | 73/106 |
| R-HSA-72695 | Formation of the ternary complex, and subsequently, the 43S complex | 2.051257 | 0.0000006 | 0.0000150 | 33/48 |
| R-HSA-72764 | Eukaryotic Translation Termination | 2.046921 | 0.0000000 | 0.0000000 | 59/86 |
| R-HSA-156827 | L13a-mediated translational silencing of Ceruloplasmin expression | 2.045929 | 0.0000000 | 0.0000000 | 72/105 |
| R-HSA-72689 | Formation of a pool of free 40S subunits | 2.041443 | 0.0000000 | 0.0000000 | 65/95 |
| R-HSA-2408557 | Selenocysteine synthesis | 2.035900 | 0.0000000 | 0.0000000 | 58/85 |
| R-HSA-389957 | Prefoldin mediated transfer of substrate to CCT/TriC | 2.034305 | 0.0009064 | 0.0201493 | 15/22 |
| R-HSA-72613 | Eukaryotic Translation Initiation | 2.006700 | 0.0000000 | 0.0000000 | 76/113 |
| R-HSA-72737 | Cap-dependent Translation Initiation | 2.006700 | 0.0000000 | 0.0000000 | 76/113 |
| GeneSet | description | enrichmentRatio | pValue | FDR | GeneRatio |
|---|---|---|---|---|---|
| R-HSA-5663084 | Diseases of carbohydrate metabolism | 2.547295 | 0.0021880 | 0.0321526 | 8/10 |
| R-HSA-912631 | Regulation of signaling by CBL | 2.547295 | 0.0021880 | 0.0321526 | 8/10 |
| R-HSA-512988 | Interleukin-3, Interleukin-5 and GM-CSF signaling | 2.388089 | 0.0004166 | 0.0079667 | 12/16 |
| R-HSA-8876725 | Protein methylation | 2.388089 | 0.0023879 | 0.0326641 | 9/12 |
| R-HSA-157858 | Gap junction trafficking and regulation | 2.346193 | 0.0001808 | 0.0039181 | 14/19 |
| R-HSA-1793185 | Chondroitin sulfate/dermatan sulfate metabolism | 2.335020 | 0.0010127 | 0.0168852 | 11/15 |
| R-HSA-190828 | Gap junction trafficking | 2.299641 | 0.0004319 | 0.0079667 | 13/18 |
| R-HSA-5626467 | RHO GTPases activate IQGAPs | 2.299641 | 0.0004319 | 0.0079667 | 13/18 |
| R-HSA-1296071 | Potassium Channels | 2.274370 | 0.0024112 | 0.0326641 | 10/14 |
| R-HSA-163359 | Glucagon signaling in metabolic regulation | 2.274370 | 0.0024112 | 0.0326641 | 10/14 |
| R-HSA-8982491 | Glycogen metabolism | 2.274370 | 0.0024112 | 0.0326641 | 10/14 |
| R-HSA-389960 | Formation of tubulin folding intermediates by CCT/TriC | 2.189082 | 0.0023242 | 0.0326641 | 11/16 |
| R-HSA-72702 | Ribosomal scanning and start codon recognition | 2.142044 | 0.0000000 | 0.0000021 | 37/55 |
| R-HSA-72695 | Formation of the ternary complex, and subsequently, the 43S complex | 2.122746 | 0.0000005 | 0.0000183 | 32/48 |
| R-HSA-156842 | Eukaryotic Translation Elongation | 2.086147 | 0.0000000 | 0.0000000 | 57/87 |
| R-HSA-437239 | Recycling pathway of L1 | 2.086147 | 0.0001548 | 0.0034410 | 19/29 |
| R-HSA-156902 | Peptide chain elongation | 2.084840 | 0.0000000 | 0.0000000 | 55/84 |
| R-HSA-72649 | Translation initiation complex formation | 2.084150 | 0.0000002 | 0.0000077 | 36/55 |
| R-HSA-3371497 | HSP90 chaperone cycle for steroid hormone receptors (SHR) | 2.065374 | 0.0000266 | 0.0008527 | 24/37 |
| R-HSA-432040 | Vasopressin regulates renal water homeostasis via Aquaporins | 2.060312 | 0.0047289 | 0.0482351 | 11/17 |
| R-HSA-445717 | Aquaporin-mediated transport | 2.060312 | 0.0047289 | 0.0482351 | 11/17 |
| R-HSA-186797 | Signaling by PDGF | 2.060312 | 0.0047289 | 0.0482351 | 11/17 |
| R-HSA-72662 | Activation of the mRNA upon binding of the cap-binding complex and eIFs, and subsequent binding to 43S | 2.046933 | 0.0000003 | 0.0000143 | 36/56 |
| R-HSA-375165 | NCAM signaling for neurite out-growth | 2.037836 | 0.0007689 | 0.0133330 | 16/25 |
| R-HSA-72764 | Eukaryotic Translation Termination | 2.036355 | 0.0000000 | 0.0000000 | 55/86 |
| R-HSA-192823 | Viral mRNA Translation | 2.033232 | 0.0000000 | 0.0000001 | 53/83 |
| R-HSA-975956 | Nonsense Mediated Decay (NMD) independent of the Exon Junction Complex (EJC) | 2.026257 | 0.0000000 | 0.0000000 | 56/88 |
| R-HSA-5654736 | Signaling by FGFR1 | 2.011022 | 0.0042276 | 0.0452512 | 12/19 |
| R-HSA-5654741 | Signaling by FGFR3 | 2.011022 | 0.0042276 | 0.0452512 | 12/19 |
| R-HSA-5654743 | Signaling by FGFR4 | 2.011022 | 0.0042276 | 0.0452512 | 12/19 |
| GeneSet | description | enrichmentRatio | pValue | FDR | GeneRatio |
|---|---|---|---|---|---|
| R-HSA-73780 | RNA Polymerase III Chain Elongation | 2.835276 | 0.0002581 | 0.0054113 | 10/13 |
| R-HSA-156902 | Peptide chain elongation | 2.544998 | 0.0000000 | 0.0000000 | 58/84 |
| R-HSA-73980 | RNA Polymerase III Transcription Termination | 2.534028 | 0.0006007 | 0.0115731 | 11/16 |
| R-HSA-156842 | Eukaryotic Translation Elongation | 2.499605 | 0.0000000 | 0.0000000 | 59/87 |
| R-HSA-192823 | Viral mRNA Translation | 2.486844 | 0.0000000 | 0.0000000 | 56/83 |
| R-HSA-2408557 | Selenocysteine synthesis | 2.471693 | 0.0000000 | 0.0000000 | 57/85 |
| R-HSA-76061 | RNA Polymerase III Transcription Initiation From Type 1 Promoter | 2.457239 | 0.0001705 | 0.0037908 | 14/21 |
| R-HSA-72764 | Eukaryotic Translation Termination | 2.442953 | 0.0000000 | 0.0000000 | 57/86 |
| R-HSA-975956 | Nonsense Mediated Decay (NMD) independent of the Exon Junction Complex (EJC) | 2.429316 | 0.0000000 | 0.0000000 | 58/88 |
| R-HSA-76066 | RNA Polymerase III Transcription Initiation From Type 2 Promoter | 2.395808 | 0.0004281 | 0.0084350 | 13/20 |
| R-HSA-72689 | Formation of a pool of free 40S subunits | 2.366709 | 0.0000000 | 0.0000000 | 61/95 |
| R-HSA-156827 | L13a-mediated translational silencing of Ceruloplasmin expression | 2.351929 | 0.0000000 | 0.0000000 | 67/105 |
| R-HSA-2408522 | Selenoamino acid metabolism | 2.345546 | 0.0000000 | 0.0000000 | 63/99 |
| R-HSA-72706 | GTP hydrolysis and joining of the 60S ribosomal subunit | 2.329741 | 0.0000000 | 0.0000000 | 67/106 |
| R-HSA-927802 | Nonsense-Mediated Decay (NMD) | 2.316825 | 0.0000000 | 0.0000000 | 66/105 |
| R-HSA-975957 | Nonsense Mediated Decay (NMD) enhanced by the Exon Junction Complex (EJC) | 2.316825 | 0.0000000 | 0.0000000 | 66/105 |
| R-HSA-5205685 | Pink/Parkin Mediated Mitophagy | 2.303662 | 0.0031443 | 0.0470017 | 10/16 |
| R-HSA-1799339 | SRP-dependent cotranslational protein targeting to membrane | 2.281722 | 0.0000000 | 0.0000000 | 65/105 |
| R-HSA-6799198 | Complex I biogenesis | 2.268221 | 0.0000002 | 0.0000050 | 32/52 |
| R-HSA-73863 | RNA Polymerase I Transcription Termination | 2.252469 | 0.0025040 | 0.0380871 | 11/18 |
| R-HSA-73772 | RNA Polymerase I Promoter Escape | 2.252469 | 0.0025040 | 0.0380871 | 11/18 |
| R-HSA-72613 | Eukaryotic Translation Initiation | 2.250657 | 0.0000000 | 0.0000000 | 69/113 |
| R-HSA-72737 | Cap-dependent Translation Initiation | 2.250657 | 0.0000000 | 0.0000000 | 69/113 |
| R-HSA-983189 | Kinesins | 2.243566 | 0.0006779 | 0.0127764 | 14/23 |
| R-HSA-72662 | Activation of the mRNA upon binding of the cap-binding complex and eIFs, and subsequent binding to 43S | 2.237843 | 0.0000001 | 0.0000034 | 34/56 |
| R-HSA-73777 | RNA Polymerase I Chain Elongation | 2.237843 | 0.0001865 | 0.0040429 | 17/28 |
| R-HSA-72695 | Formation of the ternary complex, and subsequently, the 43S complex | 2.226873 | 0.0000011 | 0.0000292 | 29/48 |
| R-HSA-72649 | Translation initiation complex formation | 2.211515 | 0.0000003 | 0.0000072 | 33/55 |
| R-HSA-76071 | RNA Polymerase III Transcription Initiation From Type 3 Promoter | 2.211515 | 0.0019811 | 0.0324790 | 12/20 |
| R-HSA-5250924 | B-WICH complex positively regulates rRNA expression | 2.211515 | 0.0001491 | 0.0034010 | 18/30 |
| R-HSA-168273 | Influenza Viral RNA Transcription and Replication | 2.173712 | 0.0000000 | 0.0000000 | 69/117 |
| R-HSA-168255 | Influenza Life Cycle | 2.152541 | 0.0000000 | 0.0000000 | 73/125 |
| R-HSA-72702 | Ribosomal scanning and start codon recognition | 2.144499 | 0.0000010 | 0.0000275 | 32/55 |
| R-HSA-917937 | Iron uptake and transport | 2.140176 | 0.0002663 | 0.0054113 | 18/31 |
| R-HSA-427413 | NoRC negatively regulates rRNA expression | 2.133918 | 0.0000588 | 0.0014560 | 22/38 |
| R-HSA-69231 | Cyclin D associated events in G1 | 2.106205 | 0.0034937 | 0.0496562 | 12/21 |
| R-HSA-69236 | G1 Phase | 2.106205 | 0.0034937 | 0.0496562 | 12/21 |
| R-HSA-5250941 | Negative epigenetic regulation of rRNA expression | 2.079202 | 0.0001007 | 0.0023602 | 22/39 |
| R-HSA-168254 | Influenza Infection | 2.078492 | 0.0000000 | 0.0000000 | 75/133 |
| R-HSA-6790901 | rRNA modification in the nucleus and cytosol | 2.057223 | 0.0000615 | 0.0014811 | 24/43 |
| R-HSA-76046 | RNA Polymerase III Transcription Initiation | 2.047699 | 0.0016229 | 0.0287148 | 15/27 |
| R-HSA-163200 | Respiratory electron transport, ATP synthesis by chemiosmotic coupling, and heat production by uncoupling proteins. | 2.036922 | 0.0000000 | 0.0000000 | 63/114 |
| R-HSA-8868773 | rRNA processing in the nucleus and cytosol | 2.035137 | 0.0000000 | 0.0000000 | 90/163 |
| R-HSA-611105 | Respiratory electron transport | 2.017523 | 0.0000000 | 0.0000003 | 52/95 |
| R-HSA-72312 | rRNA processing | 2.008462 | 0.0000000 | 0.0000000 | 91/167 |
| GeneSet | description | enrichmentRatio | pValue | FDR | GeneRatio |
|---|---|---|---|---|---|
| R-HSA-156902 | Peptide chain elongation | 3.518679 | 0.0000000 | 0.0000000 | 81/84 |
| R-HSA-192823 | Viral mRNA Translation | 3.473145 | 0.0000000 | 0.0000000 | 79/83 |
| R-HSA-156842 | Eukaryotic Translation Elongation | 3.439287 | 0.0000000 | 0.0000000 | 82/87 |
| R-HSA-2408557 | Selenocysteine synthesis | 3.391424 | 0.0000000 | 0.0000000 | 79/85 |
| R-HSA-975956 | Nonsense Mediated Decay (NMD) independent of the Exon Junction Complex (EJC) | 3.358739 | 0.0000000 | 0.0000000 | 81/88 |
| R-HSA-72764 | Eukaryotic Translation Termination | 3.351988 | 0.0000000 | 0.0000000 | 79/86 |
| R-HSA-72689 | Formation of a pool of free 40S subunits | 3.188074 | 0.0000000 | 0.0000000 | 83/95 |
| R-HSA-1799339 | SRP-dependent cotranslational protein targeting to membrane | 3.162467 | 0.0000000 | 0.0000000 | 91/105 |
| R-HSA-2408522 | Selenoamino acid metabolism | 3.096121 | 0.0000000 | 0.0000000 | 84/99 |
| R-HSA-927802 | Nonsense-Mediated Decay (NMD) | 3.023457 | 0.0000000 | 0.0000000 | 87/105 |
| R-HSA-975957 | Nonsense Mediated Decay (NMD) enhanced by the Exon Junction Complex (EJC) | 3.023457 | 0.0000000 | 0.0000000 | 87/105 |
| R-HSA-156827 | L13a-mediated translational silencing of Ceruloplasmin expression | 2.988705 | 0.0000000 | 0.0000000 | 86/105 |
| R-HSA-983170 | Antigen Presentation: Folding, assembly and peptide loading of class I MHC | 2.985546 | 0.0002665 | 0.0018785 | 9/11 |
| R-HSA-389960 | Formation of tubulin folding intermediates by CCT/TriC | 2.964812 | 0.0000109 | 0.0002055 | 13/16 |
| R-HSA-72706 | GTP hydrolysis and joining of the 60S ribosomal subunit | 2.960509 | 0.0000000 | 0.0000000 | 86/106 |
| R-HSA-72613 | Eukaryotic Translation Initiation | 2.841699 | 0.0000000 | 0.0000000 | 88/113 |
| R-HSA-72737 | Cap-dependent Translation Initiation | 2.841699 | 0.0000000 | 0.0000000 | 88/113 |
| R-HSA-168273 | Influenza Viral RNA Transcription and Replication | 2.838111 | 0.0000000 | 0.0000000 | 91/117 |
| R-HSA-5601884 | PIWI-interacting RNA (piRNA) biogenesis | 2.806923 | 0.0002827 | 0.0019451 | 10/13 |
| R-HSA-168255 | Influenza Life Cycle | 2.802432 | 0.0000000 | 0.0000000 | 96/125 |
| R-HSA-9010553 | Regulation of expression of SLITs and ROBOs | 2.767362 | 0.0000000 | 0.0000000 | 113/149 |
| R-HSA-8876725 | Protein methylation | 2.736750 | 0.0008064 | 0.0048554 | 9/12 |
| R-HSA-167160 | RNA Pol II CTD phosphorylation and interaction with CE during HIV infection | 2.736750 | 0.0000123 | 0.0002110 | 15/20 |
| R-HSA-77075 | RNA Pol II CTD phosphorylation and interaction with CE | 2.736750 | 0.0000123 | 0.0002110 | 15/20 |
| R-HSA-168254 | Influenza Infection | 2.688737 | 0.0000000 | 0.0000000 | 98/133 |
| R-HSA-72695 | Formation of the ternary complex, and subsequently, the 43S complex | 2.660729 | 0.0000000 | 0.0000000 | 35/48 |
| R-HSA-72086 | mRNA Capping | 2.653818 | 0.0000119 | 0.0002110 | 16/22 |
| R-HSA-163210 | Formation of ATP by chemiosmotic coupling | 2.635389 | 0.0000936 | 0.0008572 | 13/18 |
| R-HSA-5620922 | BBSome-mediated cargo-targeting to cilium | 2.554300 | 0.0060839 | 0.0293041 | 7/10 |
| R-HSA-72662 | Activation of the mRNA upon binding of the cap-binding complex and eIFs, and subsequent binding to 43S | 2.541268 | 0.0000000 | 0.0000000 | 39/56 |
| R-HSA-389977 | Post-chaperonin tubulin folding pathway | 2.526231 | 0.0019849 | 0.0107554 | 9/13 |
| R-HSA-72649 | Translation initiation complex formation | 2.521127 | 0.0000000 | 0.0000000 | 38/55 |
| R-HSA-72702 | Ribosomal scanning and start codon recognition | 2.521127 | 0.0000000 | 0.0000000 | 38/55 |
| R-HSA-1839126 | FGFR2 mutant receptor activation | 2.508688 | 0.0006603 | 0.0040889 | 11/16 |
| R-HSA-8851708 | Signaling by FGFR2 IIIa TM | 2.508688 | 0.0006603 | 0.0040889 | 11/16 |
| R-HSA-376176 | Signaling by ROBO receptors | 2.385101 | 0.0000000 | 0.0000000 | 117/179 |
| R-HSA-389958 | Cooperation of Prefoldin and TriC/CCT in actin and tubulin folding | 2.379783 | 0.0001625 | 0.0012866 | 15/23 |
| R-HSA-445355 | Smooth Muscle Contraction | 2.361118 | 0.0014099 | 0.0078862 | 11/17 |
| R-HSA-389957 | Prefoldin mediated transfer of substrate to CCT/TriC | 2.322091 | 0.0003954 | 0.0025774 | 14/22 |
| R-HSA-8949613 | Cristae formation | 2.311033 | 0.0000389 | 0.0004621 | 19/30 |
| R-HSA-8852276 | The role of GTSE1 in G2/M progression after G2 checkpoint | 2.297518 | 0.0000000 | 0.0000009 | 34/54 |
| R-HSA-450408 | AUF1 (hnRNP D0) binds and destabilizes mRNA | 2.251511 | 0.0000008 | 0.0000162 | 29/47 |
| R-HSA-1236975 | Antigen processing-Cross presentation | 2.245538 | 0.0000002 | 0.0000051 | 32/52 |
| R-HSA-163200 | Respiratory electron transport, ATP synthesis by chemiosmotic coupling, and heat production by uncoupling proteins. | 2.240614 | 0.0000000 | 0.0000000 | 70/114 |
| R-HSA-6791226 | Major pathway of rRNA processing in the nucleolus and cytosol | 2.231236 | 0.0000000 | 0.0000000 | 96/157 |
| R-HSA-5626467 | RHO GTPases activate IQGAPs | 2.229944 | 0.0027347 | 0.0143693 | 11/18 |
| R-HSA-5578775 | Ion homeostasis | 2.221130 | 0.0007577 | 0.0046259 | 14/23 |
| R-HSA-1236974 | ER-Phagosome pathway | 2.218020 | 0.0000005 | 0.0000114 | 31/51 |
| R-HSA-72312 | rRNA processing | 2.206880 | 0.0000000 | 0.0000000 | 101/167 |
| R-HSA-8868773 | rRNA processing in the nucleus and cytosol | 2.193877 | 0.0000000 | 0.0000000 | 98/163 |
| R-HSA-611105 | Respiratory electron transport | 2.189400 | 0.0000000 | 0.0000000 | 57/95 |
| R-HSA-71291 | Metabolism of amino acids and derivatives | 2.168745 | 0.0000000 | 0.0000000 | 126/212 |
| R-HSA-180534 | Vpu mediated degradation of CD4 | 2.156227 | 0.0000091 | 0.0001786 | 26/44 |
| R-HSA-187577 | SCF(Skp2)-mediated degradation of p27/p21 | 2.141804 | 0.0000073 | 0.0001462 | 27/46 |
| R-HSA-211733 | Regulation of activated PAK-2p34 by proteasome mediated degradation | 2.121512 | 0.0000200 | 0.0002849 | 25/43 |
| R-HSA-69601 | Ubiquitin Mediated Degradation of Phosphorylated Cdc25A | 2.121512 | 0.0000200 | 0.0002849 | 25/43 |
| R-HSA-69610 | p53-Independent DNA Damage Response | 2.121512 | 0.0000200 | 0.0002849 | 25/43 |
| R-HSA-69613 | p53-Independent G1/S DNA damage checkpoint | 2.121512 | 0.0000200 | 0.0002849 | 25/43 |
| R-HSA-174113 | SCF-beta-TrCP mediated degradation of Emi1 | 2.108311 | 0.0000159 | 0.0002468 | 26/45 |
| R-HSA-349425 | Autodegradation of the E3 ubiquitin ligase COP1 | 2.108311 | 0.0000159 | 0.0002468 | 26/45 |
| R-HSA-68827 | CDT1 association with the CDC6:ORC:origin complex | 2.108311 | 0.0000159 | 0.0002468 | 26/45 |
| R-HSA-8854050 | FBXL7 down-regulates AURKA during mitotic entry and in early mitosis | 2.108311 | 0.0000159 | 0.0002468 | 26/45 |
| R-HSA-113418 | Formation of the Early Elongation Complex | 2.105192 | 0.0010754 | 0.0062995 | 15/26 |
| R-HSA-167158 | Formation of the HIV-1 Early Elongation Complex | 2.105192 | 0.0010754 | 0.0062995 | 15/26 |
| R-HSA-5362768 | Hh mutants that don’t undergo autocatalytic processing are degraded by ERAD | 2.096234 | 0.0000127 | 0.0002110 | 27/47 |
| R-HSA-5387390 | Hh mutants abrogate ligand secretion | 2.096234 | 0.0000127 | 0.0002110 | 27/47 |
| R-HSA-9604323 | Negative regulation of NOTCH4 signaling | 2.096234 | 0.0000127 | 0.0002110 | 27/47 |
| R-HSA-5678895 | Defective CFTR causes cystic fibrosis | 2.085143 | 0.0000100 | 0.0001932 | 28/49 |
| R-HSA-69229 | Ubiquitin-dependent degradation of Cyclin D1 | 2.073295 | 0.0000345 | 0.0004212 | 25/44 |
| R-HSA-75815 | Ubiquitin-dependent degradation of Cyclin D | 2.073295 | 0.0000345 | 0.0004212 | 25/44 |
| R-HSA-169911 | Regulation of Apoptosis | 2.073295 | 0.0000345 | 0.0004212 | 25/44 |
| R-HSA-180585 | Vif-mediated degradation of APOBEC3G | 2.062478 | 0.0000272 | 0.0003551 | 26/46 |
| R-HSA-5655253 | Signaling by FGFR2 in disease | 2.062478 | 0.0029863 | 0.0154161 | 13/23 |
| R-HSA-1236978 | Cross-presentation of soluble exogenous antigens (endosomes) | 2.058410 | 0.0001187 | 0.0010212 | 22/39 |
| R-HSA-6814122 | Cooperation of PDCL (PhLP1) and TRiC/CCT in G-protein beta folding | 2.043440 | 0.0023279 | 0.0124583 | 14/25 |
| R-HSA-72766 | Translation | 2.042876 | 0.0000000 | 0.0000000 | 145/259 |
| R-HSA-350562 | Regulation of ornithine decarboxylase (ODC) | 2.036651 | 0.0000734 | 0.0007073 | 24/43 |
| R-HSA-5663205 | Infectious disease | 2.030077 | 0.0000000 | 0.0000000 | 158/284 |
| R-HSA-4641258 | Degradation of DVL | 2.027222 | 0.0000577 | 0.0006099 | 25/45 |
| R-HSA-8941858 | Regulation of RUNX3 expression and activity | 2.027222 | 0.0000577 | 0.0006099 | 25/45 |
| R-HSA-68867 | Assembly of the pre-replicative complex | 2.018596 | 0.0000453 | 0.0005234 | 26/47 |
| R-HSA-1428517 | The citric acid (TCA) cycle and respiratory electron transport | 2.015881 | 0.0000000 | 0.0000000 | 79/143 |
| R-HSA-1168372 | Downstream signaling events of B Cell Receptor (BCR) | 2.006950 | 0.0000051 | 0.0001048 | 33/60 |
| R-HSA-162588 | Budding and maturation of HIV virion | 2.006950 | 0.0082347 | 0.0385920 | 11/20 |
| R-HSA-450531 | Regulation of mRNA stability by proteins that bind AU-rich elements | 2.004380 | 0.0000007 | 0.0000157 | 39/71 |
| R-HSA-5619084 | ABC transporter disorders | 2.003372 | 0.0000279 | 0.0003551 | 28/51 |
| R-HSA-69563 | p53-Dependent G1 DNA Damage Response | 2.003372 | 0.0000279 | 0.0003551 | 28/51 |
| R-HSA-69580 | p53-Dependent G1/S DNA damage checkpoint | 2.003372 | 0.0000279 | 0.0003551 | 28/51 |
| R-HSA-69615 | G1/S DNA Damage Checkpoints | 2.003372 | 0.0000279 | 0.0003551 | 28/51 |
| GeneSet | description | enrichmentRatio | pValue | FDR | GeneRatio |
|---|---|---|---|---|---|
| R-HSA-5576892 | Phase 0 - rapid depolarisation | 4.875549 | 0.0001806 | 0.0057987 | 7/13 |
| R-HSA-445355 | Smooth Muscle Contraction | 4.793607 | 0.0000242 | 0.0009131 | 9/17 |
| R-HSA-5626467 | RHO GTPases activate IQGAPs | 4.527295 | 0.0000438 | 0.0015177 | 9/18 |
| R-HSA-389977 | Post-chaperonin tubulin folding pathway | 4.179042 | 0.0015226 | 0.0366702 | 6/13 |
| R-HSA-425393 | Transport of inorganic cations/anions and amino acids/oligopeptides | 3.621836 | 0.0007824 | 0.0205546 | 8/20 |
| R-HSA-192823 | Viral mRNA Translation | 3.163652 | 0.0000000 | 0.0000019 | 29/83 |
| R-HSA-156902 | Peptide chain elongation | 3.125990 | 0.0000000 | 0.0000019 | 29/84 |
| R-HSA-2408557 | Selenocysteine synthesis | 3.089213 | 0.0000000 | 0.0000019 | 29/85 |
| R-HSA-72764 | Eukaryotic Translation Termination | 3.053292 | 0.0000000 | 0.0000020 | 29/86 |
| R-HSA-156842 | Eukaryotic Translation Elongation | 3.018197 | 0.0000000 | 0.0000023 | 29/87 |
| R-HSA-975956 | Nonsense Mediated Decay (NMD) independent of the Exon Junction Complex (EJC) | 2.983899 | 0.0000000 | 0.0000026 | 29/88 |
| R-HSA-397014 | Muscle contraction | 2.963321 | 0.0000122 | 0.0004825 | 18/55 |
| R-HSA-3371497 | HSP90 chaperone cycle for steroid hormone receptors (SHR) | 2.936624 | 0.0003923 | 0.0113369 | 12/37 |
| R-HSA-425407 | SLC-mediated transmembrane transport | 2.929426 | 0.0007018 | 0.0190140 | 11/34 |
| R-HSA-2408522 | Selenoamino acid metabolism | 2.926736 | 0.0000000 | 0.0000019 | 32/99 |
| R-HSA-5576891 | Cardiac conduction | 2.766681 | 0.0012011 | 0.0297533 | 11/36 |
| R-HSA-72689 | Formation of a pool of free 40S subunits | 2.764033 | 0.0000001 | 0.0000088 | 29/95 |
| R-HSA-156827 | L13a-mediated translational silencing of Ceruloplasmin expression | 2.673260 | 0.0000001 | 0.0000082 | 31/105 |
| R-HSA-927802 | Nonsense-Mediated Decay (NMD) | 2.673260 | 0.0000001 | 0.0000082 | 31/105 |
| R-HSA-975957 | Nonsense Mediated Decay (NMD) enhanced by the Exon Junction Complex (EJC) | 2.673260 | 0.0000001 | 0.0000082 | 31/105 |
| R-HSA-72706 | GTP hydrolysis and joining of the 60S ribosomal subunit | 2.648041 | 0.0000002 | 0.0000090 | 31/106 |
| R-HSA-72613 | Eukaryotic Translation Initiation | 2.644261 | 0.0000001 | 0.0000055 | 33/113 |
| R-HSA-72737 | Cap-dependent Translation Initiation | 2.644261 | 0.0000001 | 0.0000055 | 33/113 |
| R-HSA-1799339 | SRP-dependent cotranslational protein targeting to membrane | 2.500792 | 0.0000015 | 0.0000762 | 29/105 |
| R-HSA-168273 | Influenza Viral RNA Transcription and Replication | 2.321690 | 0.0000053 | 0.0002420 | 30/117 |
| R-HSA-9010553 | Regulation of expression of SLITs and ROBOs | 2.309224 | 0.0000003 | 0.0000174 | 38/149 |
| R-HSA-168255 | Influenza Life Cycle | 2.245538 | 0.0000078 | 0.0003213 | 31/125 |
| R-HSA-168254 | Influenza Infection | 2.110469 | 0.0000298 | 0.0010751 | 31/133 |
| R-HSA-112316 | Neuronal System | 2.076741 | 0.0002337 | 0.0072372 | 25/109 |
| R-HSA-376176 | Signaling by ROBO receptors | 2.073956 | 0.0000024 | 0.0001134 | 41/179 |
| R-HSA-112315 | Transmission across Chemical Synapses | 2.023967 | 0.0018041 | 0.0422734 | 19/85 |
| GeneSet | description | enrichmentRatio | pValue | FDR | GeneRatio |
|---|---|---|---|---|---|
| R-HSA-191273 | Cholesterol biosynthesis | 5.350440 | 0.0000000 | 0.0000003 | 16/22 |
| R-HSA-445355 | Smooth Muscle Contraction | 4.327562 | 0.0000157 | 0.0005300 | 10/17 |
| R-HSA-2426168 | Activation of gene expression by SREBF (SREBP) | 3.433199 | 0.0000111 | 0.0004002 | 14/30 |
| R-HSA-1655829 | Regulation of cholesterol biosynthesis by SREBP (SREBF) | 3.269713 | 0.0000057 | 0.0002143 | 16/36 |
| R-HSA-70263 | Gluconeogenesis | 3.097623 | 0.0021020 | 0.0467282 | 8/19 |
| R-HSA-8957322 | Metabolism of steroids | 3.055924 | 0.0000000 | 0.0000021 | 27/65 |
| R-HSA-192823 | Viral mRNA Translation | 2.925015 | 0.0000000 | 0.0000005 | 33/83 |
| R-HSA-72764 | Eukaryotic Translation Termination | 2.908524 | 0.0000000 | 0.0000005 | 34/86 |
| R-HSA-156902 | Peptide chain elongation | 2.890193 | 0.0000000 | 0.0000006 | 33/84 |
| R-HSA-2408557 | Selenocysteine synthesis | 2.856191 | 0.0000000 | 0.0000007 | 33/85 |
| R-HSA-156842 | Eukaryotic Translation Elongation | 2.790531 | 0.0000000 | 0.0000011 | 33/87 |
| R-HSA-975956 | Nonsense Mediated Decay (NMD) independent of the Exon Junction Complex (EJC) | 2.758821 | 0.0000000 | 0.0000013 | 33/88 |
| R-HSA-977225 | Amyloid fiber formation | 2.724761 | 0.0018953 | 0.0432429 | 10/27 |
| R-HSA-114608 | Platelet degranulation | 2.675220 | 0.0001131 | 0.0031622 | 16/44 |
| R-HSA-76005 | Response to elevated platelet cytosolic Ca2+ | 2.675220 | 0.0001131 | 0.0031622 | 16/44 |
| R-HSA-72689 | Formation of a pool of free 40S subunits | 2.555539 | 0.0000001 | 0.0000083 | 33/95 |
| R-HSA-397014 | Muscle contraction | 2.541459 | 0.0000590 | 0.0018282 | 19/55 |
| R-HSA-2408522 | Selenoamino acid metabolism | 2.526597 | 0.0000001 | 0.0000080 | 34/99 |
| R-HSA-1799339 | SRP-dependent cotranslational protein targeting to membrane | 2.452285 | 0.0000001 | 0.0000099 | 35/105 |
| R-HSA-168273 | Influenza Viral RNA Transcription and Replication | 2.326527 | 0.0000003 | 0.0000168 | 37/117 |
| R-HSA-156827 | L13a-mediated translational silencing of Ceruloplasmin expression | 2.312154 | 0.0000013 | 0.0000616 | 33/105 |
| R-HSA-927802 | Nonsense-Mediated Decay (NMD) | 2.312154 | 0.0000013 | 0.0000616 | 33/105 |
| R-HSA-975957 | Nonsense Mediated Decay (NMD) enhanced by the Exon Junction Complex (EJC) | 2.312154 | 0.0000013 | 0.0000616 | 33/105 |
| R-HSA-168255 | Influenza Life Cycle | 2.295339 | 0.0000002 | 0.0000127 | 39/125 |
| R-HSA-72706 | GTP hydrolysis and joining of the 60S ribosomal subunit | 2.290342 | 0.0000017 | 0.0000743 | 33/106 |
| R-HSA-72613 | Eukaryotic Translation Initiation | 2.213567 | 0.0000028 | 0.0001117 | 34/113 |
| R-HSA-72737 | Cap-dependent Translation Initiation | 2.213567 | 0.0000028 | 0.0001117 | 34/113 |
| R-HSA-168254 | Influenza Infection | 2.212588 | 0.0000004 | 0.0000227 | 40/133 |
| R-HSA-373760 | L1CAM interactions | 2.055592 | 0.0012682 | 0.0323389 | 19/68 |
| GeneSet | description | enrichmentRatio | pValue | FDR | GeneRatio |
|---|---|---|---|---|---|
| R-HSA-445095 | Interaction between L1 and Ankyrins | 3.326724 | 0.0009379 | 0.0262297 | 8/15 |
| R-HSA-5627123 | RHO GTPases activate PAKs | 3.282951 | 0.0002423 | 0.0084014 | 10/19 |
| R-HSA-163210 | Formation of ATP by chemiosmotic coupling | 3.118803 | 0.0008176 | 0.0236293 | 9/18 |
| R-HSA-389960 | Formation of tubulin folding intermediates by CCT/TriC | 3.118803 | 0.0016151 | 0.0371583 | 8/16 |
| R-HSA-389957 | Prefoldin mediated transfer of substrate to CCT/TriC | 2.835276 | 0.0010720 | 0.0281647 | 10/22 |
| R-HSA-983189 | Kinesins | 2.712003 | 0.0016286 | 0.0371583 | 10/23 |
| R-HSA-389958 | Cooperation of Prefoldin and TriC/CCT in actin and tubulin folding | 2.712003 | 0.0016286 | 0.0371583 | 10/23 |
| R-HSA-156902 | Peptide chain elongation | 2.376231 | 0.0000006 | 0.0001893 | 32/84 |
| R-HSA-3371497 | HSP90 chaperone cycle for steroid hormone receptors (SHR) | 2.360176 | 0.0010633 | 0.0281647 | 14/37 |
| R-HSA-2408557 | Selenocysteine synthesis | 2.348276 | 0.0000009 | 0.0001893 | 32/85 |
| R-HSA-192823 | Viral mRNA Translation | 2.329709 | 0.0000016 | 0.0001975 | 31/83 |
| R-HSA-156842 | Eukaryotic Translation Elongation | 2.294292 | 0.0000016 | 0.0001975 | 32/87 |
| R-HSA-975956 | Nonsense Mediated Decay (NMD) independent of the Exon Junction Complex (EJC) | 2.268221 | 0.0000021 | 0.0002312 | 32/88 |
| R-HSA-72764 | Eukaryotic Translation Termination | 2.248440 | 0.0000038 | 0.0003685 | 31/86 |
| R-HSA-2408522 | Selenoamino acid metabolism | 2.205214 | 0.0000015 | 0.0001975 | 35/99 |
| R-HSA-927802 | Nonsense-Mediated Decay (NMD) | 2.198014 | 0.0000008 | 0.0001893 | 37/105 |
| R-HSA-975957 | Nonsense Mediated Decay (NMD) enhanced by the Exon Junction Complex (EJC) | 2.198014 | 0.0000008 | 0.0001893 | 37/105 |
| R-HSA-72689 | Formation of a pool of free 40S subunits | 2.166748 | 0.0000047 | 0.0004116 | 33/95 |
| R-HSA-1799339 | SRP-dependent cotranslational protein targeting to membrane | 2.079202 | 0.0000071 | 0.0005175 | 35/105 |
| R-HSA-72695 | Formation of the ternary complex, and subsequently, the 43S complex | 2.079202 | 0.0022836 | 0.0460444 | 16/48 |
| GeneSet | description | enrichmentRatio | pValue | FDR | GeneRatio |
|---|---|---|---|---|---|
| R-HSA-156902 | Peptide chain elongation | 4.407005 | 0.0000000 | 0.0000000 | 63/84 |
| R-HSA-192823 | Viral mRNA Translation | 4.389306 | 0.0000000 | 0.0000000 | 62/83 |
| R-HSA-2408557 | Selenocysteine synthesis | 4.355158 | 0.0000000 | 0.0000000 | 63/85 |
| R-HSA-72764 | Eukaryotic Translation Termination | 4.304516 | 0.0000000 | 0.0000000 | 63/86 |
| R-HSA-156842 | Eukaryotic Translation Elongation | 4.255039 | 0.0000000 | 0.0000000 | 63/87 |
| R-HSA-975956 | Nonsense Mediated Decay (NMD) independent of the Exon Junction Complex (EJC) | 4.139914 | 0.0000000 | 0.0000000 | 62/88 |
| R-HSA-2408522 | Selenoamino acid metabolism | 3.976691 | 0.0000000 | 0.0000000 | 67/99 |
| R-HSA-5626467 | RHO GTPases activate IQGAPs | 3.917338 | 0.0000037 | 0.0000936 | 12/18 |
| R-HSA-72689 | Formation of a pool of free 40S subunits | 3.896720 | 0.0000000 | 0.0000000 | 63/95 |
| R-HSA-72695 | Formation of the ternary complex, and subsequently, the 43S complex | 3.794921 | 0.0000000 | 0.0000000 | 31/48 |
| R-HSA-1799339 | SRP-dependent cotranslational protein targeting to membrane | 3.749452 | 0.0000000 | 0.0000000 | 67/105 |
| R-HSA-72706 | GTP hydrolysis and joining of the 60S ribosomal subunit | 3.658645 | 0.0000000 | 0.0000000 | 66/106 |
| R-HSA-156827 | L13a-mediated translational silencing of Ceruloplasmin expression | 3.637528 | 0.0000000 | 0.0000000 | 65/105 |
| R-HSA-373080 | Class B/2 (Secretin family receptors) | 3.616004 | 0.0003892 | 0.0086511 | 8/13 |
| R-HSA-190828 | Gap junction trafficking | 3.590893 | 0.0000320 | 0.0007927 | 11/18 |
| R-HSA-5218921 | VEGFR2 mediated cell proliferation | 3.525604 | 0.0026850 | 0.0415698 | 6/10 |
| R-HSA-927802 | Nonsense-Mediated Decay (NMD) | 3.525604 | 0.0000000 | 0.0000000 | 63/105 |
| R-HSA-975957 | Nonsense Mediated Decay (NMD) enhanced by the Exon Junction Complex (EJC) | 3.525604 | 0.0000000 | 0.0000000 | 63/105 |
| R-HSA-72613 | Eukaryotic Translation Initiation | 3.484004 | 0.0000000 | 0.0000000 | 67/113 |
| R-HSA-72737 | Cap-dependent Translation Initiation | 3.484004 | 0.0000000 | 0.0000000 | 67/113 |
| R-HSA-427359 | SIRT1 negatively regulates rRNA expression | 3.427670 | 0.0014398 | 0.0290298 | 7/12 |
| R-HSA-72702 | Ribosomal scanning and start codon recognition | 3.418767 | 0.0000000 | 0.0000000 | 32/55 |
| R-HSA-157858 | Gap junction trafficking and regulation | 3.401899 | 0.0000644 | 0.0015380 | 11/19 |
| R-HSA-168273 | Influenza Viral RNA Transcription and Replication | 3.364893 | 0.0000000 | 0.0000000 | 67/117 |
| R-HSA-72662 | Activation of the mRNA upon binding of the cap-binding complex and eIFs, and subsequent binding to 43S | 3.357718 | 0.0000000 | 0.0000000 | 32/56 |
| R-HSA-72649 | Translation initiation complex formation | 3.311931 | 0.0000000 | 0.0000000 | 31/55 |
| R-HSA-389957 | Prefoldin mediated transfer of substrate to CCT/TriC | 3.205094 | 0.0000656 | 0.0015380 | 12/22 |
| R-HSA-389977 | Post-chaperonin tubulin folding pathway | 3.164004 | 0.0026655 | 0.0415698 | 7/13 |
| R-HSA-168255 | Influenza Life Cycle | 3.149539 | 0.0000000 | 0.0000000 | 67/125 |
| R-HSA-389958 | Cooperation of Prefoldin and TriC/CCT in actin and tubulin folding | 3.065742 | 0.0001162 | 0.0026519 | 12/23 |
| R-HSA-168254 | Influenza Infection | 3.004274 | 0.0000000 | 0.0000000 | 68/133 |
| R-HSA-389960 | Formation of tubulin folding intermediates by CCT/TriC | 2.938003 | 0.0024089 | 0.0401646 | 8/16 |
| R-HSA-451326 | Activation of kainate receptors upon glutamate binding | 2.938003 | 0.0024089 | 0.0401646 | 8/16 |
| R-HSA-9010553 | Regulation of expression of SLITs and ROBOs | 2.878849 | 0.0000000 | 0.0000000 | 73/149 |
| R-HSA-427389 | ERCC6 (CSB) and EHMT2 (G9a) positively regulate rRNA expression | 2.810264 | 0.0005958 | 0.0129150 | 11/23 |
| R-HSA-977225 | Amyloid fiber formation | 2.611558 | 0.0007705 | 0.0162924 | 12/27 |
| R-HSA-6791226 | Major pathway of rRNA processing in the nucleolus and cytosol | 2.582449 | 0.0000000 | 0.0000000 | 69/157 |
| R-HSA-376176 | Signaling by ROBO receptors | 2.527668 | 0.0000000 | 0.0000000 | 77/179 |
| R-HSA-8868773 | rRNA processing in the nucleus and cytosol | 2.523438 | 0.0000000 | 0.0000000 | 70/163 |
| R-HSA-72312 | rRNA processing | 2.462997 | 0.0000000 | 0.0000000 | 70/167 |
| R-HSA-71291 | Metabolism of amino acids and derivatives | 2.439097 | 0.0000000 | 0.0000000 | 88/212 |
| R-HSA-3214858 | RMTs methylate histone arginines | 2.431451 | 0.0016538 | 0.0318624 | 12/29 |
| R-HSA-500792 | GPCR ligand binding | 2.393929 | 0.0029834 | 0.0453790 | 11/27 |
| R-HSA-72766 | Translation | 2.382165 | 0.0000000 | 0.0000000 | 105/259 |
| R-HSA-3371497 | HSP90 chaperone cycle for steroid hormone receptors (SHR) | 2.223354 | 0.0019383 | 0.0355181 | 14/37 |
| R-HSA-1445148 | Translocation of SLC2A4 (GLUT4) to the plasma membrane | 2.043828 | 0.0026191 | 0.0415698 | 16/46 |
| R-HSA-422475 | Axon guidance | 2.036063 | 0.0000000 | 0.0000000 | 114/329 |
| GeneSet | description | enrichmentRatio | pValue | FDR | GeneRatio |
|---|---|---|---|---|---|
| R-HSA-442729 | CREB phosphorylation through the activation of CaMKII | 6.701561 | 0.0000900 | 0.0043352 | 6/11 |
| R-HSA-442982 | Ras activation upon Ca2+ influx through NMDA receptor | 6.701561 | 0.0000900 | 0.0043352 | 6/11 |
| R-HSA-5576892 | Phase 0 - rapid depolarisation | 6.615644 | 0.0000247 | 0.0017836 | 7/13 |
| R-HSA-5218921 | VEGFR2 mediated cell proliferation | 6.143098 | 0.0006185 | 0.0191500 | 5/10 |
| R-HSA-114604 | GPVI-mediated activation cascade | 5.584634 | 0.0010588 | 0.0245060 | 5/11 |
| R-HSA-442742 | CREB phosphorylation through the activation of Ras | 5.375210 | 0.0001327 | 0.0052305 | 7/16 |
| R-HSA-5578775 | Ion homeostasis | 5.341824 | 0.0000048 | 0.0005237 | 10/23 |
| R-HSA-445355 | Smooth Muscle Contraction | 5.059022 | 0.0002101 | 0.0075881 | 7/17 |
| R-HSA-5576891 | Cardiac conduction | 4.777965 | 0.0000003 | 0.0000660 | 14/36 |
| R-HSA-5626467 | RHO GTPases activate IQGAPs | 4.777965 | 0.0003200 | 0.0110983 | 7/18 |
| R-HSA-451326 | Activation of kainate receptors upon glutamate binding | 4.607323 | 0.0010981 | 0.0245060 | 6/16 |
| R-HSA-438064 | Post NMDA receptor activation events | 4.300168 | 0.0006759 | 0.0201960 | 7/20 |
| R-HSA-936837 | Ion transport by P-type ATPases | 4.252914 | 0.0001254 | 0.0051783 | 9/26 |
| R-HSA-397014 | Muscle contraction | 4.244322 | 0.0000000 | 0.0000093 | 19/55 |
| R-HSA-114608 | Platelet degranulation | 4.188476 | 0.0000008 | 0.0001220 | 15/44 |
| R-HSA-76005 | Response to elevated platelet cytosolic Ca2+ | 4.188476 | 0.0000008 | 0.0001220 | 15/44 |
| R-HSA-418346 | Platelet homeostasis | 4.095398 | 0.0000757 | 0.0041015 | 10/30 |
| R-HSA-442755 | Activation of NMDA receptors and postsynaptic events | 4.095398 | 0.0009442 | 0.0238917 | 7/21 |
| R-HSA-2672351 | Stimuli-sensing channels | 3.780368 | 0.0007454 | 0.0201960 | 8/26 |
| R-HSA-381426 | Regulation of Insulin-like Growth Factor (IGF) transport and uptake by Insulin-like Growth Factor Binding Proteins (IGFBPs) | 3.723089 | 0.0001870 | 0.0070481 | 10/33 |
| R-HSA-4086398 | Ca2+ pathway | 3.583474 | 0.0022711 | 0.0418938 | 7/24 |
| R-HSA-8957275 | Post-translational protein phosphorylation | 3.455492 | 0.0007269 | 0.0201960 | 9/32 |
| R-HSA-76002 | Platelet activation, signaling and aggregation | 3.412832 | 0.0000000 | 0.0000093 | 25/90 |
| R-HSA-112314 | Neurotransmitter receptors and postsynaptic signal transmission | 2.948687 | 0.0004884 | 0.0158333 | 12/50 |
| R-HSA-983712 | Ion channel transport | 2.925285 | 0.0001075 | 0.0049037 | 15/63 |
| R-HSA-373760 | L1CAM interactions | 2.890869 | 0.0000738 | 0.0041015 | 16/68 |
| R-HSA-6799198 | Complex I biogenesis | 2.835276 | 0.0007159 | 0.0201960 | 12/52 |
| R-HSA-1474244 | Extracellular matrix organization | 2.730266 | 0.0010260 | 0.0245060 | 12/54 |
| R-HSA-611105 | Respiratory electron transport | 2.715896 | 0.0000155 | 0.0012209 | 21/95 |
| R-HSA-194138 | Signaling by VEGF | 2.680624 | 0.0012188 | 0.0264170 | 12/55 |
| R-HSA-112315 | Transmission across Chemical Synapses | 2.601783 | 0.0001156 | 0.0050119 | 18/85 |
| R-HSA-163200 | Respiratory electron transport, ATP synthesis by chemiosmotic coupling, and heat production by uncoupling proteins. | 2.586567 | 0.0000092 | 0.0008880 | 24/114 |
| R-HSA-112316 | Neuronal System | 2.479782 | 0.0000441 | 0.0029396 | 22/109 |
| R-HSA-109582 | Hemostasis | 2.470594 | 0.0000001 | 0.0000299 | 37/184 |
| R-HSA-156842 | Eukaryotic Translation Elongation | 2.400751 | 0.0004931 | 0.0158333 | 17/87 |
| R-HSA-192823 | Viral mRNA Translation | 2.368423 | 0.0008416 | 0.0221100 | 16/83 |
| R-HSA-156902 | Peptide chain elongation | 2.340228 | 0.0009645 | 0.0238917 | 16/84 |
| R-HSA-2408557 | Selenocysteine synthesis | 2.312696 | 0.0011023 | 0.0245060 | 16/85 |
| R-HSA-72764 | Eukaryotic Translation Termination | 2.285804 | 0.0012565 | 0.0265714 | 16/86 |
| R-HSA-1428517 | The citric acid (TCA) cycle and respiratory electron transport | 2.233854 | 0.0000600 | 0.0037153 | 26/143 |
| R-HSA-975956 | Nonsense Mediated Decay (NMD) independent of the Exon Junction Complex (EJC) | 2.233854 | 0.0016201 | 0.0321045 | 16/88 |
| R-HSA-72689 | Formation of a pool of free 40S subunits | 2.198582 | 0.0014015 | 0.0289311 | 17/95 |
| R-HSA-927802 | Nonsense-Mediated Decay (NMD) | 2.106205 | 0.0017034 | 0.0321045 | 18/105 |
| R-HSA-975957 | Nonsense Mediated Decay (NMD) enhanced by the Exon Junction Complex (EJC) | 2.106205 | 0.0017034 | 0.0321045 | 18/105 |
| R-HSA-1799339 | SRP-dependent cotranslational protein targeting to membrane | 2.106205 | 0.0017034 | 0.0321045 | 18/105 |
| GeneSet | description | enrichmentRatio | pValue | FDR | GeneRatio |
|---|---|---|---|---|---|
| R-HSA-3769402 | Deactivation of the beta-catenin transactivating complex | 9.80914 | 0.0001106 | 0.0479298 | 5/20 |
| R-HSA-195258 | RHO GTPase Effectors | 3.46990 | 0.0000693 | 0.0479298 | 13/147 |
| GeneSet | description | enrichmentRatio | pValue | FDR | GeneRatio |
|---|---|---|---|---|---|
| R-HSA-5626467 | RHO GTPases activate IQGAPs | 7.327309 | 0.0000008 | 0.0001702 | 9/18 |
| R-HSA-418990 | Adherens junctions interactions | 7.327309 | 0.0000620 | 0.0021880 | 6/12 |
| R-HSA-373076 | Class A/1 (Rhodopsin-like receptors) | 6.661190 | 0.0004671 | 0.0094172 | 5/11 |
| R-HSA-442729 | CREB phosphorylation through the activation of CaMKII | 6.661190 | 0.0004671 | 0.0094172 | 5/11 |
| R-HSA-442982 | Ras activation upon Ca2+ influx through NMDA receptor | 6.661190 | 0.0004671 | 0.0094172 | 5/11 |
| R-HSA-451326 | Activation of kainate receptors upon glutamate binding | 6.411396 | 0.0000425 | 0.0017260 | 7/16 |
| R-HSA-8978934 | Metabolism of cofactors | 6.106091 | 0.0007564 | 0.0121444 | 5/12 |
| R-HSA-202131 | Metabolism of nitric oxide | 6.106091 | 0.0007564 | 0.0121444 | 5/12 |
| R-HSA-203765 | eNOS activation and regulation | 6.106091 | 0.0007564 | 0.0121444 | 5/12 |
| R-HSA-445355 | Smooth Muscle Contraction | 6.034255 | 0.0000681 | 0.0021880 | 7/17 |
| R-HSA-445095 | Interaction between L1 and Ankyrins | 5.861847 | 0.0002818 | 0.0066023 | 6/15 |
| R-HSA-5576892 | Phase 0 - rapid depolarisation | 5.636392 | 0.0011613 | 0.0167806 | 5/13 |
| R-HSA-421270 | Cell-cell junction organization | 5.495482 | 0.0004253 | 0.0092182 | 6/16 |
| R-HSA-4086398 | Ca2+ pathway | 5.495482 | 0.0000147 | 0.0016228 | 9/24 |
| R-HSA-5578775 | Ion homeostasis | 5.097259 | 0.0000838 | 0.0025736 | 8/23 |
| R-HSA-446728 | Cell junction organization | 5.072752 | 0.0000310 | 0.0017260 | 9/26 |
| R-HSA-500792 | GPCR ligand binding | 4.884873 | 0.0000438 | 0.0017260 | 9/27 |
| R-HSA-442755 | Activation of NMDA receptors and postsynaptic events | 4.884873 | 0.0003213 | 0.0071434 | 7/21 |
| R-HSA-190828 | Gap junction trafficking | 4.884873 | 0.0008776 | 0.0130845 | 6/18 |
| R-HSA-157858 | Gap junction trafficking and regulation | 4.627774 | 0.0012103 | 0.0172024 | 6/19 |
| R-HSA-442742 | CREB phosphorylation through the activation of Ras | 4.579568 | 0.0033259 | 0.0424051 | 5/16 |
| R-HSA-936837 | Ion transport by P-type ATPases | 4.509113 | 0.0002230 | 0.0055248 | 8/26 |
| R-HSA-381426 | Regulation of Insulin-like Growth Factor (IGF) transport and uptake by Insulin-like Growth Factor Binding Proteins (IGFBPs) | 4.440793 | 0.0000417 | 0.0017260 | 10/33 |
| R-HSA-438064 | Post NMDA receptor activation events | 4.396386 | 0.0016316 | 0.0228163 | 6/20 |
| R-HSA-397014 | Muscle contraction | 4.263162 | 0.0000004 | 0.0001058 | 16/55 |
| R-HSA-1500931 | Cell-Cell communication | 4.133354 | 0.0000362 | 0.0017260 | 11/39 |
| R-HSA-8957275 | Post-translational protein phosphorylation | 4.121611 | 0.0001936 | 0.0049368 | 9/32 |
| R-HSA-5576891 | Cardiac conduction | 4.070727 | 0.0000953 | 0.0026648 | 10/36 |
| R-HSA-114608 | Platelet degranulation | 3.996714 | 0.0000231 | 0.0016318 | 12/44 |
| R-HSA-76005 | Response to elevated platelet cytosolic Ca2+ | 3.996714 | 0.0000231 | 0.0016318 | 12/44 |
| R-HSA-5218920 | VEGFR2 mediated vascular permeability | 3.996714 | 0.0027975 | 0.0367496 | 6/22 |
| R-HSA-418346 | Platelet homeostasis | 3.907898 | 0.0006576 | 0.0114027 | 8/30 |
| R-HSA-112314 | Neurotransmitter receptors and postsynaptic signal transmission | 3.810201 | 0.0000185 | 0.0016318 | 13/50 |
| R-HSA-1474244 | Extracellular matrix organization | 3.799345 | 0.0000091 | 0.0013088 | 14/54 |
| R-HSA-416482 | G alpha (12/13) signalling events | 3.781837 | 0.0008349 | 0.0126993 | 8/31 |
| R-HSA-373760 | L1CAM interactions | 3.663655 | 0.0000017 | 0.0002913 | 17/68 |
| R-HSA-194840 | Rho GTPase cycle | 3.256582 | 0.0006914 | 0.0117546 | 10/45 |
| R-HSA-1445148 | Translocation of SLC2A4 (GLUT4) to the plasma membrane | 3.185787 | 0.0008315 | 0.0126993 | 10/46 |
| R-HSA-418594 | G alpha (i) signalling events | 3.156379 | 0.0000861 | 0.0025736 | 14/65 |
| R-HSA-156842 | Eukaryotic Translation Elongation | 3.031990 | 0.0000150 | 0.0016228 | 18/87 |
| R-HSA-192823 | Viral mRNA Translation | 3.001548 | 0.0000299 | 0.0017260 | 17/83 |
| R-HSA-156902 | Peptide chain elongation | 2.965816 | 0.0000353 | 0.0017260 | 17/84 |
| R-HSA-2408557 | Selenocysteine synthesis | 2.930924 | 0.0000414 | 0.0017260 | 17/85 |
| R-HSA-76002 | Platelet activation, signaling and aggregation | 2.930924 | 0.0000245 | 0.0016318 | 18/90 |
| R-HSA-72764 | Eukaryotic Translation Termination | 2.896843 | 0.0000485 | 0.0018280 | 17/86 |
| R-HSA-975956 | Nonsense Mediated Decay (NMD) independent of the Exon Junction Complex (EJC) | 2.831006 | 0.0000660 | 0.0021880 | 17/88 |
| R-HSA-194138 | Signaling by VEGF | 2.664476 | 0.0034594 | 0.0434687 | 10/55 |
| R-HSA-1799339 | SRP-dependent cotranslational protein targeting to membrane | 2.651788 | 0.0000631 | 0.0021880 | 19/105 |
| R-HSA-72689 | Formation of a pool of free 40S subunits | 2.622405 | 0.0001785 | 0.0046893 | 17/95 |
| R-HSA-372790 | Signaling by GPCR | 2.621151 | 0.0000198 | 0.0016318 | 22/123 |
| R-HSA-388396 | GPCR downstream signalling | 2.586109 | 0.0000380 | 0.0017260 | 21/119 |
| R-HSA-112315 | Transmission across Chemical Synapses | 2.586109 | 0.0005025 | 0.0098043 | 15/85 |
| R-HSA-983712 | Ion channel transport | 2.558743 | 0.0030651 | 0.0396631 | 11/63 |
| R-HSA-2408522 | Selenoamino acid metabolism | 2.516450 | 0.0002996 | 0.0068346 | 17/99 |
| R-HSA-72706 | GTP hydrolysis and joining of the 60S ribosomal subunit | 2.488520 | 0.0002301 | 0.0055412 | 18/106 |
| R-HSA-156827 | L13a-mediated translational silencing of Ceruloplasmin expression | 2.372653 | 0.0006127 | 0.0108412 | 17/105 |
| R-HSA-927802 | Nonsense-Mediated Decay (NMD) | 2.372653 | 0.0006127 | 0.0108412 | 17/105 |
| R-HSA-975957 | Nonsense Mediated Decay (NMD) enhanced by the Exon Junction Complex (EJC) | 2.372653 | 0.0006127 | 0.0108412 | 17/105 |
| R-HSA-72613 | Eukaryotic Translation Initiation | 2.334364 | 0.0005202 | 0.0098043 | 18/113 |
| R-HSA-72737 | Cap-dependent Translation Initiation | 2.334364 | 0.0005202 | 0.0098043 | 18/113 |
| R-HSA-422475 | Axon guidance | 2.316232 | 0.0000000 | 0.0000008 | 52/329 |
| R-HSA-168273 | Influenza Viral RNA Transcription and Replication | 2.254557 | 0.0007988 | 0.0125925 | 18/117 |
| R-HSA-1266738 | Developmental Biology | 2.173494 | 0.0000000 | 0.0000001 | 66/445 |
| R-HSA-112316 | Neuronal System | 2.151137 | 0.0025651 | 0.0342145 | 16/109 |
| R-HSA-109582 | Hemostasis | 2.150406 | 0.0000910 | 0.0026301 | 27/184 |
| R-HSA-194315 | Signaling by Rho GTPases | 2.138782 | 0.0001001 | 0.0027125 | 27/185 |
| R-HSA-168255 | Influenza Life Cycle | 2.110265 | 0.0017532 | 0.0241276 | 18/125 |
| GeneSet | description | enrichmentRatio | pValue | FDR | GeneRatio |
|---|---|---|---|---|---|
| R-HSA-389960 | Formation of tubulin folding intermediates by CCT/TriC | 4.402751 | 0.0000110 | 0.0002500 | 10/16 |
| R-HSA-389977 | Post-chaperonin tubulin folding pathway | 4.335016 | 0.0001044 | 0.0020577 | 8/13 |
| R-HSA-5626467 | RHO GTPases activate IQGAPs | 4.304912 | 0.0000053 | 0.0001429 | 11/18 |
| R-HSA-163210 | Formation of ATP by chemiosmotic coupling | 4.304912 | 0.0000053 | 0.0001429 | 11/18 |
| R-HSA-389958 | Cooperation of Prefoldin and TriC/CCT in actin and tubulin folding | 4.287897 | 0.0000003 | 0.0000091 | 14/23 |
| R-HSA-389957 | Prefoldin mediated transfer of substrate to CCT/TriC | 4.162601 | 0.0000012 | 0.0000372 | 13/22 |
| R-HSA-8876725 | Protein methylation | 4.109234 | 0.0004629 | 0.0071660 | 7/12 |
| R-HSA-8978934 | Metabolism of cofactors | 4.109234 | 0.0004629 | 0.0071660 | 7/12 |
| R-HSA-70263 | Gluconeogenesis | 4.078338 | 0.0000109 | 0.0002500 | 11/19 |
| R-HSA-191273 | Cholesterol biosynthesis | 3.842401 | 0.0000099 | 0.0002373 | 12/22 |
| R-HSA-190828 | Gap junction trafficking | 3.522201 | 0.0003216 | 0.0054672 | 9/18 |
| R-HSA-157858 | Gap junction trafficking and regulation | 3.336822 | 0.0005351 | 0.0081388 | 9/19 |
| R-HSA-8949613 | Cristae formation | 3.287387 | 0.0000185 | 0.0004011 | 14/30 |
| R-HSA-3299685 | Detoxification of Reactive Oxygen Species | 3.130845 | 0.0018414 | 0.0238288 | 8/18 |
| R-HSA-70614 | Amino acid synthesis and interconversion (transamination) | 3.081926 | 0.0039901 | 0.0437904 | 7/16 |
| R-HSA-3371497 | HSP90 chaperone cycle for steroid hormone receptors (SHR) | 3.046228 | 0.0000155 | 0.0003448 | 16/37 |
| R-HSA-156902 | Peptide chain elongation | 2.935167 | 0.0000000 | 0.0000001 | 35/84 |
| R-HSA-379716 | Cytosolic tRNA aminoacylation | 2.935167 | 0.0009173 | 0.0130371 | 10/24 |
| R-HSA-437239 | Recycling pathway of L1 | 2.914925 | 0.0003052 | 0.0052916 | 12/29 |
| R-HSA-2408557 | Selenocysteine synthesis | 2.900636 | 0.0000000 | 0.0000001 | 35/85 |
| R-HSA-192823 | Viral mRNA Translation | 2.885658 | 0.0000000 | 0.0000001 | 34/83 |
| R-HSA-156842 | Eukaryotic Translation Elongation | 2.833955 | 0.0000000 | 0.0000001 | 35/87 |
| R-HSA-975956 | Nonsense Mediated Decay (NMD) independent of the Exon Junction Complex (EJC) | 2.801751 | 0.0000000 | 0.0000002 | 35/88 |
| R-HSA-72764 | Eukaryotic Translation Termination | 2.784996 | 0.0000000 | 0.0000003 | 34/86 |
| R-HSA-2408522 | Selenoamino acid metabolism | 2.775067 | 0.0000000 | 0.0000001 | 39/99 |
| R-HSA-1655829 | Regulation of cholesterol biosynthesis by SREBP (SREBF) | 2.739489 | 0.0002122 | 0.0037543 | 14/36 |
| R-HSA-72689 | Formation of a pool of free 40S subunits | 2.669457 | 0.0000000 | 0.0000004 | 36/95 |
| R-HSA-163200 | Respiratory electron transport, ATP synthesis by chemiosmotic coupling, and heat production by uncoupling proteins. | 2.657099 | 0.0000000 | 0.0000001 | 43/114 |
| R-HSA-1799339 | SRP-dependent cotranslational protein targeting to membrane | 2.616492 | 0.0000000 | 0.0000002 | 39/105 |
| R-HSA-2426168 | Activation of gene expression by SREBF (SREBP) | 2.582947 | 0.0017916 | 0.0235355 | 11/30 |
| R-HSA-114608 | Platelet degranulation | 2.561601 | 0.0001911 | 0.0036019 | 16/44 |
| R-HSA-76005 | Response to elevated platelet cytosolic Ca2+ | 2.561601 | 0.0001911 | 0.0036019 | 16/44 |
| R-HSA-391251 | Protein folding | 2.550559 | 0.0000208 | 0.0004404 | 21/58 |
| R-HSA-156827 | L13a-mediated translational silencing of Ceruloplasmin expression | 2.549402 | 0.0000000 | 0.0000005 | 38/105 |
| R-HSA-379724 | tRNA Aminoacylation | 2.515858 | 0.0036043 | 0.0411169 | 10/28 |
| R-HSA-72613 | Eukaryotic Translation Initiation | 2.493593 | 0.0000000 | 0.0000004 | 40/113 |
| R-HSA-72737 | Cap-dependent Translation Initiation | 2.493593 | 0.0000000 | 0.0000004 | 40/113 |
| R-HSA-72706 | GTP hydrolysis and joining of the 60S ribosomal subunit | 2.458895 | 0.0000000 | 0.0000019 | 37/106 |
| R-HSA-1445148 | Translocation of SLC2A4 (GLUT4) to the plasma membrane | 2.450227 | 0.0003453 | 0.0057571 | 16/46 |
| R-HSA-168255 | Influenza Life Cycle | 2.423274 | 0.0000000 | 0.0000004 | 43/125 |
| R-HSA-927802 | Nonsense-Mediated Decay (NMD) | 2.415223 | 0.0000001 | 0.0000045 | 36/105 |
| R-HSA-975957 | Nonsense Mediated Decay (NMD) enhanced by the Exon Junction Complex (EJC) | 2.415223 | 0.0000001 | 0.0000045 | 36/105 |
| R-HSA-1428517 | The citric acid (TCA) cycle and respiratory electron transport | 2.413816 | 0.0000000 | 0.0000001 | 49/143 |
| R-HSA-390466 | Chaperonin-mediated protein folding | 2.392438 | 0.0002099 | 0.0037543 | 18/53 |
| R-HSA-611105 | Respiratory electron transport | 2.372851 | 0.0000009 | 0.0000299 | 32/95 |
| R-HSA-168254 | Influenza Infection | 2.330479 | 0.0000000 | 0.0000007 | 44/133 |
| R-HSA-168273 | Influenza Viral RNA Transcription and Replication | 2.287925 | 0.0000003 | 0.0000088 | 38/117 |
| R-HSA-6811436 | COPI-independent Golgi-to-ER retrograde traffic | 2.284671 | 0.0036998 | 0.0411243 | 12/37 |
| R-HSA-1592230 | Mitochondrial biogenesis | 2.272388 | 0.0002101 | 0.0037543 | 20/62 |
| R-HSA-15869 | Metabolism of nucleotides | 2.241401 | 0.0021578 | 0.0275119 | 14/44 |
| R-HSA-2565942 | Regulation of PLK1 Activity at G2/M Transition | 2.224548 | 0.0005800 | 0.0086706 | 18/57 |
| R-HSA-9010553 | Regulation of expression of SLITs and ROBOs | 2.222059 | 0.0000000 | 0.0000011 | 47/149 |
| R-HSA-71291 | Metabolism of amino acids and derivatives | 2.193068 | 0.0000000 | 0.0000000 | 66/212 |
| R-HSA-380259 | Loss of Nlp from mitotic centrosomes | 2.191592 | 0.0027344 | 0.0324760 | 14/45 |
| R-HSA-380284 | Loss of proteins required for interphase microtubule organization from the centrosome | 2.191592 | 0.0027344 | 0.0324760 | 14/45 |
| R-HSA-8854518 | AURKA Activation by TPX2 | 2.191592 | 0.0027344 | 0.0324760 | 14/45 |
| R-HSA-8957322 | Metabolism of steroids | 2.167508 | 0.0004267 | 0.0068504 | 20/65 |
| R-HSA-6799198 | Complex I biogenesis | 2.167508 | 0.0015839 | 0.0214571 | 16/52 |
| R-HSA-5628897 | TP53 Regulates Metabolic Genes | 2.102806 | 0.0006614 | 0.0095579 | 20/67 |
| R-HSA-8852276 | The role of GTSE1 in G2/M progression after G2 checkpoint | 2.087230 | 0.0024521 | 0.0304056 | 16/54 |
| R-HSA-72662 | Activation of the mRNA upon binding of the cap-binding complex and eIFs, and subsequent binding to 43S | 2.012686 | 0.0036836 | 0.0411243 | 16/56 |
| R-HSA-376176 | Signaling by ROBO receptors | 2.007064 | 0.0000003 | 0.0000088 | 51/179 |
| GeneSet | description | enrichmentRatio | pValue | FDR | GeneRatio |
|---|---|---|---|---|---|
| R-HSA-156902 | Peptide chain elongation | 8.313967 | 0.0000000 | 0.0000000 | 40/84 |
| R-HSA-72689 | Formation of a pool of free 40S subunits | 8.270209 | 0.0000000 | 0.0000000 | 45/95 |
| R-HSA-156842 | Eukaryotic Translation Elongation | 8.027278 | 0.0000000 | 0.0000000 | 40/87 |
| R-HSA-2408557 | Selenocysteine synthesis | 8.010751 | 0.0000000 | 0.0000000 | 39/85 |
| R-HSA-192823 | Viral mRNA Translation | 7.993428 | 0.0000000 | 0.0000000 | 38/83 |
| R-HSA-156827 | L13a-mediated translational silencing of Ceruloplasmin expression | 7.981408 | 0.0000000 | 0.0000000 | 48/105 |
| R-HSA-72706 | GTP hydrolysis and joining of the 60S ribosomal subunit | 7.741401 | 0.0000000 | 0.0000000 | 47/106 |
| R-HSA-975956 | Nonsense Mediated Decay (NMD) independent of the Exon Junction Complex (EJC) | 7.737658 | 0.0000000 | 0.0000000 | 39/88 |
| R-HSA-72764 | Eukaryotic Translation Termination | 7.714588 | 0.0000000 | 0.0000000 | 38/86 |
| R-HSA-72613 | Eukaryotic Translation Initiation | 7.416353 | 0.0000000 | 0.0000000 | 48/113 |
| R-HSA-72737 | Cap-dependent Translation Initiation | 7.416353 | 0.0000000 | 0.0000000 | 48/113 |
| R-HSA-72695 | Formation of the ternary complex, and subsequently, the 43S complex | 6.910985 | 0.0000000 | 0.0000000 | 19/48 |
| R-HSA-2408522 | Selenoamino acid metabolism | 6.877918 | 0.0000000 | 0.0000000 | 39/99 |
| R-HSA-72649 | Translation initiation complex formation | 6.666290 | 0.0000000 | 0.0000000 | 21/55 |
| R-HSA-927802 | Nonsense-Mediated Decay (NMD) | 6.651173 | 0.0000000 | 0.0000000 | 40/105 |
| R-HSA-975957 | Nonsense Mediated Decay (NMD) enhanced by the Exon Junction Complex (EJC) | 6.651173 | 0.0000000 | 0.0000000 | 40/105 |
| R-HSA-1799339 | SRP-dependent cotranslational protein targeting to membrane | 6.651173 | 0.0000000 | 0.0000000 | 40/105 |
| R-HSA-72662 | Activation of the mRNA upon binding of the cap-binding complex and eIFs, and subsequent binding to 43S | 6.547249 | 0.0000000 | 0.0000000 | 21/56 |
| R-HSA-72702 | Ribosomal scanning and start codon recognition | 6.348847 | 0.0000000 | 0.0000000 | 20/55 |
| R-HSA-168273 | Influenza Viral RNA Transcription and Replication | 5.819777 | 0.0000000 | 0.0000000 | 39/117 |
| R-HSA-163210 | Formation of ATP by chemiosmotic coupling | 5.819777 | 0.0003412 | 0.0079950 | 6/18 |
| R-HSA-168255 | Influenza Life Cycle | 5.586986 | 0.0000000 | 0.0000000 | 40/125 |
| R-HSA-168254 | Influenza Infection | 5.382199 | 0.0000000 | 0.0000000 | 41/133 |
| R-HSA-9010553 | Regulation of expression of SLITs and ROBOs | 4.569892 | 0.0000000 | 0.0000000 | 39/149 |
| R-HSA-6791226 | Major pathway of rRNA processing in the nucleolus and cytosol | 4.225825 | 0.0000000 | 0.0000000 | 38/157 |
| R-HSA-437239 | Recycling pathway of L1 | 4.214321 | 0.0009670 | 0.0214970 | 7/29 |
| R-HSA-163200 | Respiratory electron transport, ATP synthesis by chemiosmotic coupling, and heat production by uncoupling proteins. | 4.135104 | 0.0000000 | 0.0000000 | 27/114 |
| R-HSA-8868773 | rRNA processing in the nucleus and cytosol | 4.070273 | 0.0000000 | 0.0000000 | 38/163 |
| R-HSA-376176 | Signaling by ROBO receptors | 3.999064 | 0.0000000 | 0.0000000 | 41/179 |
| R-HSA-72312 | rRNA processing | 3.972782 | 0.0000000 | 0.0000000 | 38/167 |
| R-HSA-611105 | Respiratory electron transport | 3.859431 | 0.0000000 | 0.0000010 | 21/95 |
| R-HSA-72766 | Translation | 3.774990 | 0.0000000 | 0.0000000 | 56/259 |
| R-HSA-1428517 | The citric acid (TCA) cycle and respiratory electron transport | 3.540703 | 0.0000000 | 0.0000000 | 29/143 |
| R-HSA-71291 | Metabolism of amino acids and derivatives | 3.458924 | 0.0000000 | 0.0000000 | 42/212 |
| R-HSA-6799198 | Complex I biogenesis | 3.357563 | 0.0005806 | 0.0132472 | 10/52 |
| R-HSA-5663205 | Infectious disease | 3.135302 | 0.0000000 | 0.0000000 | 51/284 |
| R-HSA-422475 | Axon guidance | 2.865665 | 0.0000000 | 0.0000000 | 54/329 |
| R-HSA-1266738 | Developmental Biology | 2.354067 | 0.0000000 | 0.0000000 | 60/445 |
| R-HSA-1643685 | Disease | 2.077624 | 0.0000000 | 0.0000003 | 57/479 |
| GeneSet | description | enrichmentRatio | pValue | FDR | GeneRatio |
|---|---|---|---|---|---|
| R-HSA-983695 | Antigen activates B Cell Receptor (BCR) leading to generation of second messengers | 9.296815 | 0.0005654 | 0.0196096 | 4/10 |
| R-HSA-5626467 | RHO GTPases activate IQGAPs | 9.038570 | 0.0000051 | 0.0022100 | 7/18 |
| R-HSA-111447 | Activation of BAD and translocation to mitochondria | 8.451650 | 0.0008589 | 0.0240227 | 4/11 |
| R-HSA-442729 | CREB phosphorylation through the activation of CaMKII | 8.451650 | 0.0008589 | 0.0240227 | 4/11 |
| R-HSA-442982 | Ras activation upon Ca2+ influx through NMDA receptor | 8.451650 | 0.0008589 | 0.0240227 | 4/11 |
| R-HSA-5339562 | Uptake and actions of bacterial toxins | 8.203072 | 0.0000481 | 0.0069546 | 6/17 |
| R-HSA-8978934 | Metabolism of cofactors | 7.747346 | 0.0012455 | 0.0281957 | 4/12 |
| R-HSA-202131 | Metabolism of nitric oxide | 7.747346 | 0.0012455 | 0.0281957 | 4/12 |
| R-HSA-203765 | eNOS activation and regulation | 7.747346 | 0.0012455 | 0.0281957 | 4/12 |
| R-HSA-5576892 | Phase 0 - rapid depolarisation | 7.151396 | 0.0017393 | 0.0327819 | 4/13 |
| R-HSA-389977 | Post-chaperonin tubulin folding pathway | 7.151396 | 0.0017393 | 0.0327819 | 4/13 |
| R-HSA-1483249 | Inositol phosphate metabolism | 7.151396 | 0.0017393 | 0.0327819 | 4/13 |
| R-HSA-425393 | Transport of inorganic cations/anions and amino acids/oligopeptides | 5.810510 | 0.0012683 | 0.0281957 | 5/20 |
| R-HSA-1445148 | Translocation of SLC2A4 (GLUT4) to the plasma membrane | 5.557879 | 0.0000024 | 0.0020686 | 11/46 |
| R-HSA-442755 | Activation of NMDA receptors and postsynaptic events | 5.533819 | 0.0016075 | 0.0324126 | 5/21 |
| R-HSA-5218920 | VEGFR2 mediated vascular permeability | 5.282281 | 0.0020090 | 0.0355477 | 5/22 |
| R-HSA-72662 | Activation of the mRNA upon binding of the cap-binding complex and eIFs, and subsequent binding to 43S | 4.565400 | 0.0000183 | 0.0039708 | 11/56 |
| R-HSA-72695 | Formation of the ternary complex, and subsequently, the 43S complex | 4.357882 | 0.0001591 | 0.0153238 | 9/48 |
| R-HSA-72649 | Translation initiation complex formation | 4.225825 | 0.0000895 | 0.0097047 | 10/55 |
| R-HSA-72702 | Ribosomal scanning and start codon recognition | 4.225825 | 0.0000895 | 0.0097047 | 10/55 |
| R-HSA-114608 | Platelet degranulation | 4.225825 | 0.0004639 | 0.0194565 | 8/44 |
| R-HSA-76005 | Response to elevated platelet cytosolic Ca2+ | 4.225825 | 0.0004639 | 0.0194565 | 8/44 |
| R-HSA-425407 | SLC-mediated transmembrane transport | 4.101536 | 0.0028476 | 0.0457205 | 6/34 |
| R-HSA-373760 | L1CAM interactions | 3.417947 | 0.0005490 | 0.0196096 | 10/68 |
| R-HSA-156842 | Eukaryotic Translation Elongation | 3.205798 | 0.0002840 | 0.0166676 | 12/87 |
| R-HSA-192823 | Viral mRNA Translation | 3.080270 | 0.0007248 | 0.0232739 | 11/83 |
| R-HSA-2408522 | Selenoamino acid metabolism | 3.051985 | 0.0002608 | 0.0166676 | 13/99 |
| R-HSA-156902 | Peptide chain elongation | 3.043600 | 0.0008035 | 0.0240227 | 11/84 |
| R-HSA-2408557 | Selenocysteine synthesis | 3.007793 | 0.0008892 | 0.0240917 | 11/85 |
| R-HSA-195258 | RHO GTPase Effectors | 3.004073 | 0.0000117 | 0.0033928 | 19/147 |
| R-HSA-72764 | Eukaryotic Translation Termination | 2.972819 | 0.0009823 | 0.0258087 | 11/86 |
| R-HSA-975956 | Nonsense Mediated Decay (NMD) independent of the Exon Junction Complex (EJC) | 2.905255 | 0.0011929 | 0.0281957 | 11/88 |
| R-HSA-72613 | Eukaryotic Translation Initiation | 2.879545 | 0.0002812 | 0.0166676 | 14/113 |
| R-HSA-72737 | Cap-dependent Translation Initiation | 2.879545 | 0.0002812 | 0.0166676 | 14/113 |
| R-HSA-156827 | L13a-mediated translational silencing of Ceruloplasmin expression | 2.877586 | 0.0004701 | 0.0194565 | 13/105 |
| R-HSA-72706 | GTP hydrolysis and joining of the 60S ribosomal subunit | 2.850439 | 0.0005161 | 0.0194565 | 13/106 |
| R-HSA-168255 | Influenza Life Cycle | 2.789045 | 0.0002427 | 0.0166676 | 15/125 |
| R-HSA-168273 | Influenza Viral RNA Transcription and Replication | 2.781099 | 0.0004058 | 0.0194565 | 14/117 |
| R-HSA-72689 | Formation of a pool of free 40S subunits | 2.691183 | 0.0022431 | 0.0373988 | 11/95 |
| R-HSA-1799339 | SRP-dependent cotranslational protein targeting to membrane | 2.656233 | 0.0015947 | 0.0324126 | 12/105 |
| R-HSA-168254 | Influenza Infection | 2.621282 | 0.0004814 | 0.0194565 | 15/133 |
| R-HSA-68877 | Mitotic Prometaphase | 2.606584 | 0.0018797 | 0.0346740 | 12/107 |
| R-HSA-71291 | Metabolism of amino acids and derivatives | 2.521542 | 0.0000259 | 0.0044839 | 23/212 |
| R-HSA-2555396 | Mitotic Metaphase and Anaphase | 2.456476 | 0.0021076 | 0.0358296 | 13/123 |
| R-HSA-68882 | Mitotic Anaphase | 2.456476 | 0.0021076 | 0.0358296 | 13/123 |
| R-HSA-69620 | Cell Cycle Checkpoints | 2.421046 | 0.0011190 | 0.0281957 | 15/144 |
| R-HSA-194315 | Signaling by Rho GTPases | 2.387020 | 0.0002884 | 0.0166676 | 19/185 |
| R-HSA-68886 | M Phase | 2.224118 | 0.0005098 | 0.0194565 | 20/209 |
| R-HSA-6791226 | Major pathway of rRNA processing in the nucleolus and cytosol | 2.220577 | 0.0026787 | 0.0438195 | 15/157 |
| R-HSA-5663205 | Infectious disease | 2.045954 | 0.0003609 | 0.0194565 | 25/284 |
| GeneSet | description | enrichmentRatio | pValue | FDR | GeneRatio |
|---|---|---|---|---|---|
| R-HSA-2871809 | FCERI mediated Ca+2 mobilization | 11.639553 | 0.0002517 | 0.0189361 | 4/11 |
| R-HSA-442729 | CREB phosphorylation through the activation of CaMKII | 11.639553 | 0.0002517 | 0.0189361 | 4/11 |
| R-HSA-442982 | Ras activation upon Ca2+ influx through NMDA receptor | 11.639553 | 0.0002517 | 0.0189361 | 4/11 |
| R-HSA-8876725 | Protein methylation | 10.669591 | 0.0003685 | 0.0213016 | 4/12 |
| R-HSA-451326 | Activation of kainate receptors upon glutamate binding | 10.002741 | 0.0000904 | 0.0111986 | 5/16 |
| R-HSA-500792 | GPCR ligand binding | 9.484081 | 0.0000010 | 0.0004162 | 8/27 |
| R-HSA-8982491 | Glycogen metabolism | 9.145363 | 0.0007100 | 0.0304598 | 4/14 |
| R-HSA-5626467 | RHO GTPases activate IQGAPs | 8.891326 | 0.0001687 | 0.0182799 | 5/18 |
| R-HSA-2672351 | Stimuli-sensing channels | 8.617746 | 0.0000097 | 0.0028088 | 7/26 |
| R-HSA-5578775 | Ion homeostasis | 8.350114 | 0.0000533 | 0.0077003 | 6/23 |
| R-HSA-442742 | CREB phosphorylation through the activation of Ras | 8.002193 | 0.0012298 | 0.0444267 | 4/16 |
| R-HSA-4086398 | Ca2+ pathway | 6.668494 | 0.0007201 | 0.0304598 | 5/24 |
| R-HSA-418346 | Platelet homeostasis | 6.401754 | 0.0002621 | 0.0189361 | 6/30 |
| R-HSA-418594 | G alpha (i) signalling events | 5.909312 | 0.0000005 | 0.0004162 | 12/65 |
| R-HSA-5576891 | Cardiac conduction | 5.334795 | 0.0007378 | 0.0304598 | 6/36 |
| R-HSA-114608 | Platelet degranulation | 5.092305 | 0.0003553 | 0.0213016 | 7/44 |
| R-HSA-76005 | Response to elevated platelet cytosolic Ca2+ | 5.092305 | 0.0003553 | 0.0213016 | 7/44 |
| R-HSA-112314 | Neurotransmitter receptors and postsynaptic signal transmission | 4.481228 | 0.0007932 | 0.0312581 | 7/50 |
| R-HSA-194138 | Signaling by VEGF | 4.073844 | 0.0014166 | 0.0491286 | 7/55 |
| R-HSA-983712 | Ion channel transport | 4.064606 | 0.0006545 | 0.0304598 | 8/63 |
| R-HSA-388396 | GPCR downstream signalling | 3.765738 | 0.0000142 | 0.0030881 | 14/119 |
| R-HSA-373760 | L1CAM interactions | 3.765738 | 0.0010969 | 0.0413468 | 8/68 |
| R-HSA-372790 | Signaling by GPCR | 3.643275 | 0.0000209 | 0.0036285 | 14/123 |
| R-HSA-76002 | Platelet activation, signaling and aggregation | 3.556530 | 0.0004160 | 0.0225434 | 10/90 |
| R-HSA-109582 | Hemostasis | 2.609411 | 0.0004966 | 0.0253246 | 15/184 |
| Factor | 1 | 2 | 3 | 4 | 5 | 6 | 7 | 8 | 9 | 10 |
| Signif_GO_terms | 0 | 43 | 0 | 0 | 17 | 30 | 45 | 89 | 31 | 29 |
| Factor | 11 | 12 | 13 | 14 | 15 | 16 | 17 | 18 | 19 | 20 |
| Signif_GO_terms | 20 | 47 | 45 | 2 | 67 | 62 | 39 | 0 | 50 | 25 |