Both GSFA and DE analysis were conducted on genes filtered by the criterion of detection rate > 10% (8046 genes kept).
1 Differential Gene Expression Test
We can compare the gene expression profiles of cells under each KO (gRNA) condition with those of cells without this gRNA using either Wilcoxon rank sum test or Welch’s t-test.
We have 2 variations on the gene expression data we use: (1) log-CPM expression; (2) corrected expression: log-CPM data corrected for batch effect and other confounding factors and then scaled. The 2nd kind is the expression data we passed to GSFA.
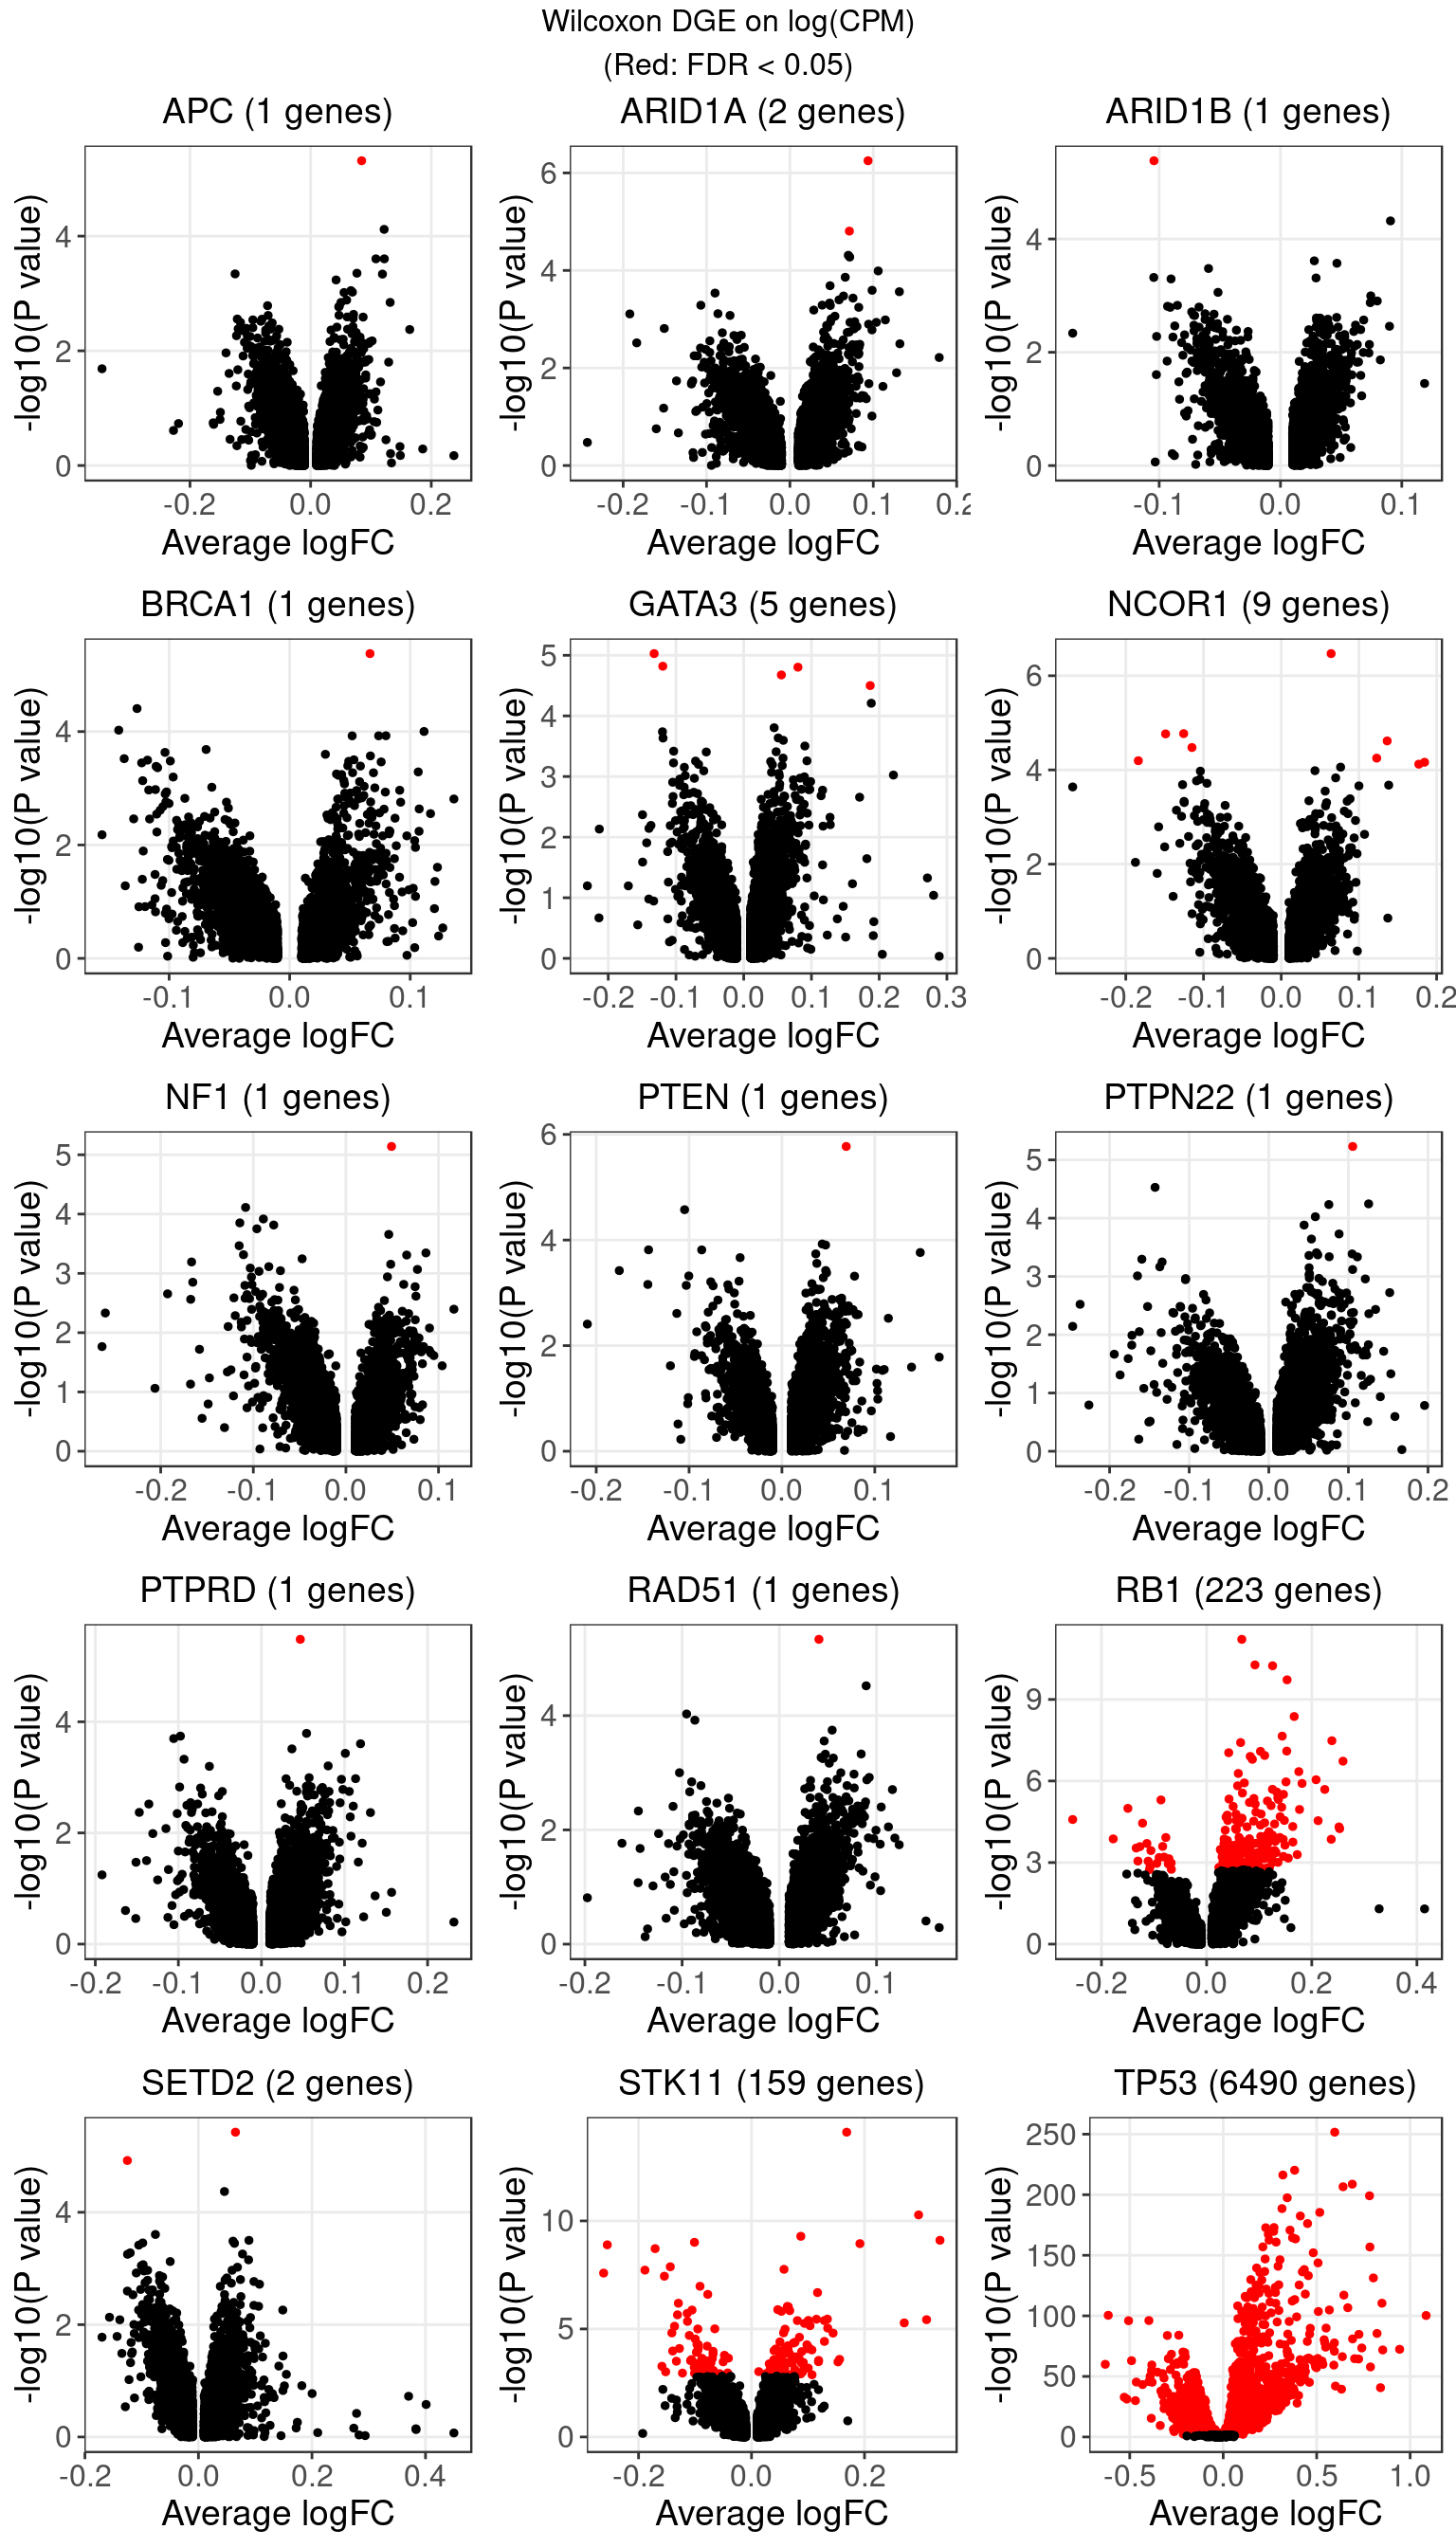
1.1 Wilcoxon rank sum test on log-CPM expression
The number of genes that passed an FDR threshold of 0.05 (Benjamini-Hochberg) under each KO condition is:
| KO | APC | ARID1A | ARID1B | ATM | BAP1 | BID | BRCA1 | BRCA2 | CASP8 | CDH1 |
| Num_genes | 1 | 2 | 1 | 0 | 0 | 0 | 1 | 0 | 0 | 0 |
| KO | CDKN1B | CDKN2A | CHEK1 | CTCF | GATA3 | MLH1 | MLL2 | MLL3 | NCOR1 | NF1 |
| Num_genes | 0 | 0 | 0 | 0 | 5 | 0 | 0 | 0 | 9 | 1 |
| KO | NONTARGETING | PTEN | PTPN22 | PTPRD | RAD51 | RB1 | RUNX1 | SETD2 | STK11 | TP53 |
| Num_genes | 0 | 1 | 1 | 1 | 1 | 223 | 0 | 2 | 159 | 6490 |
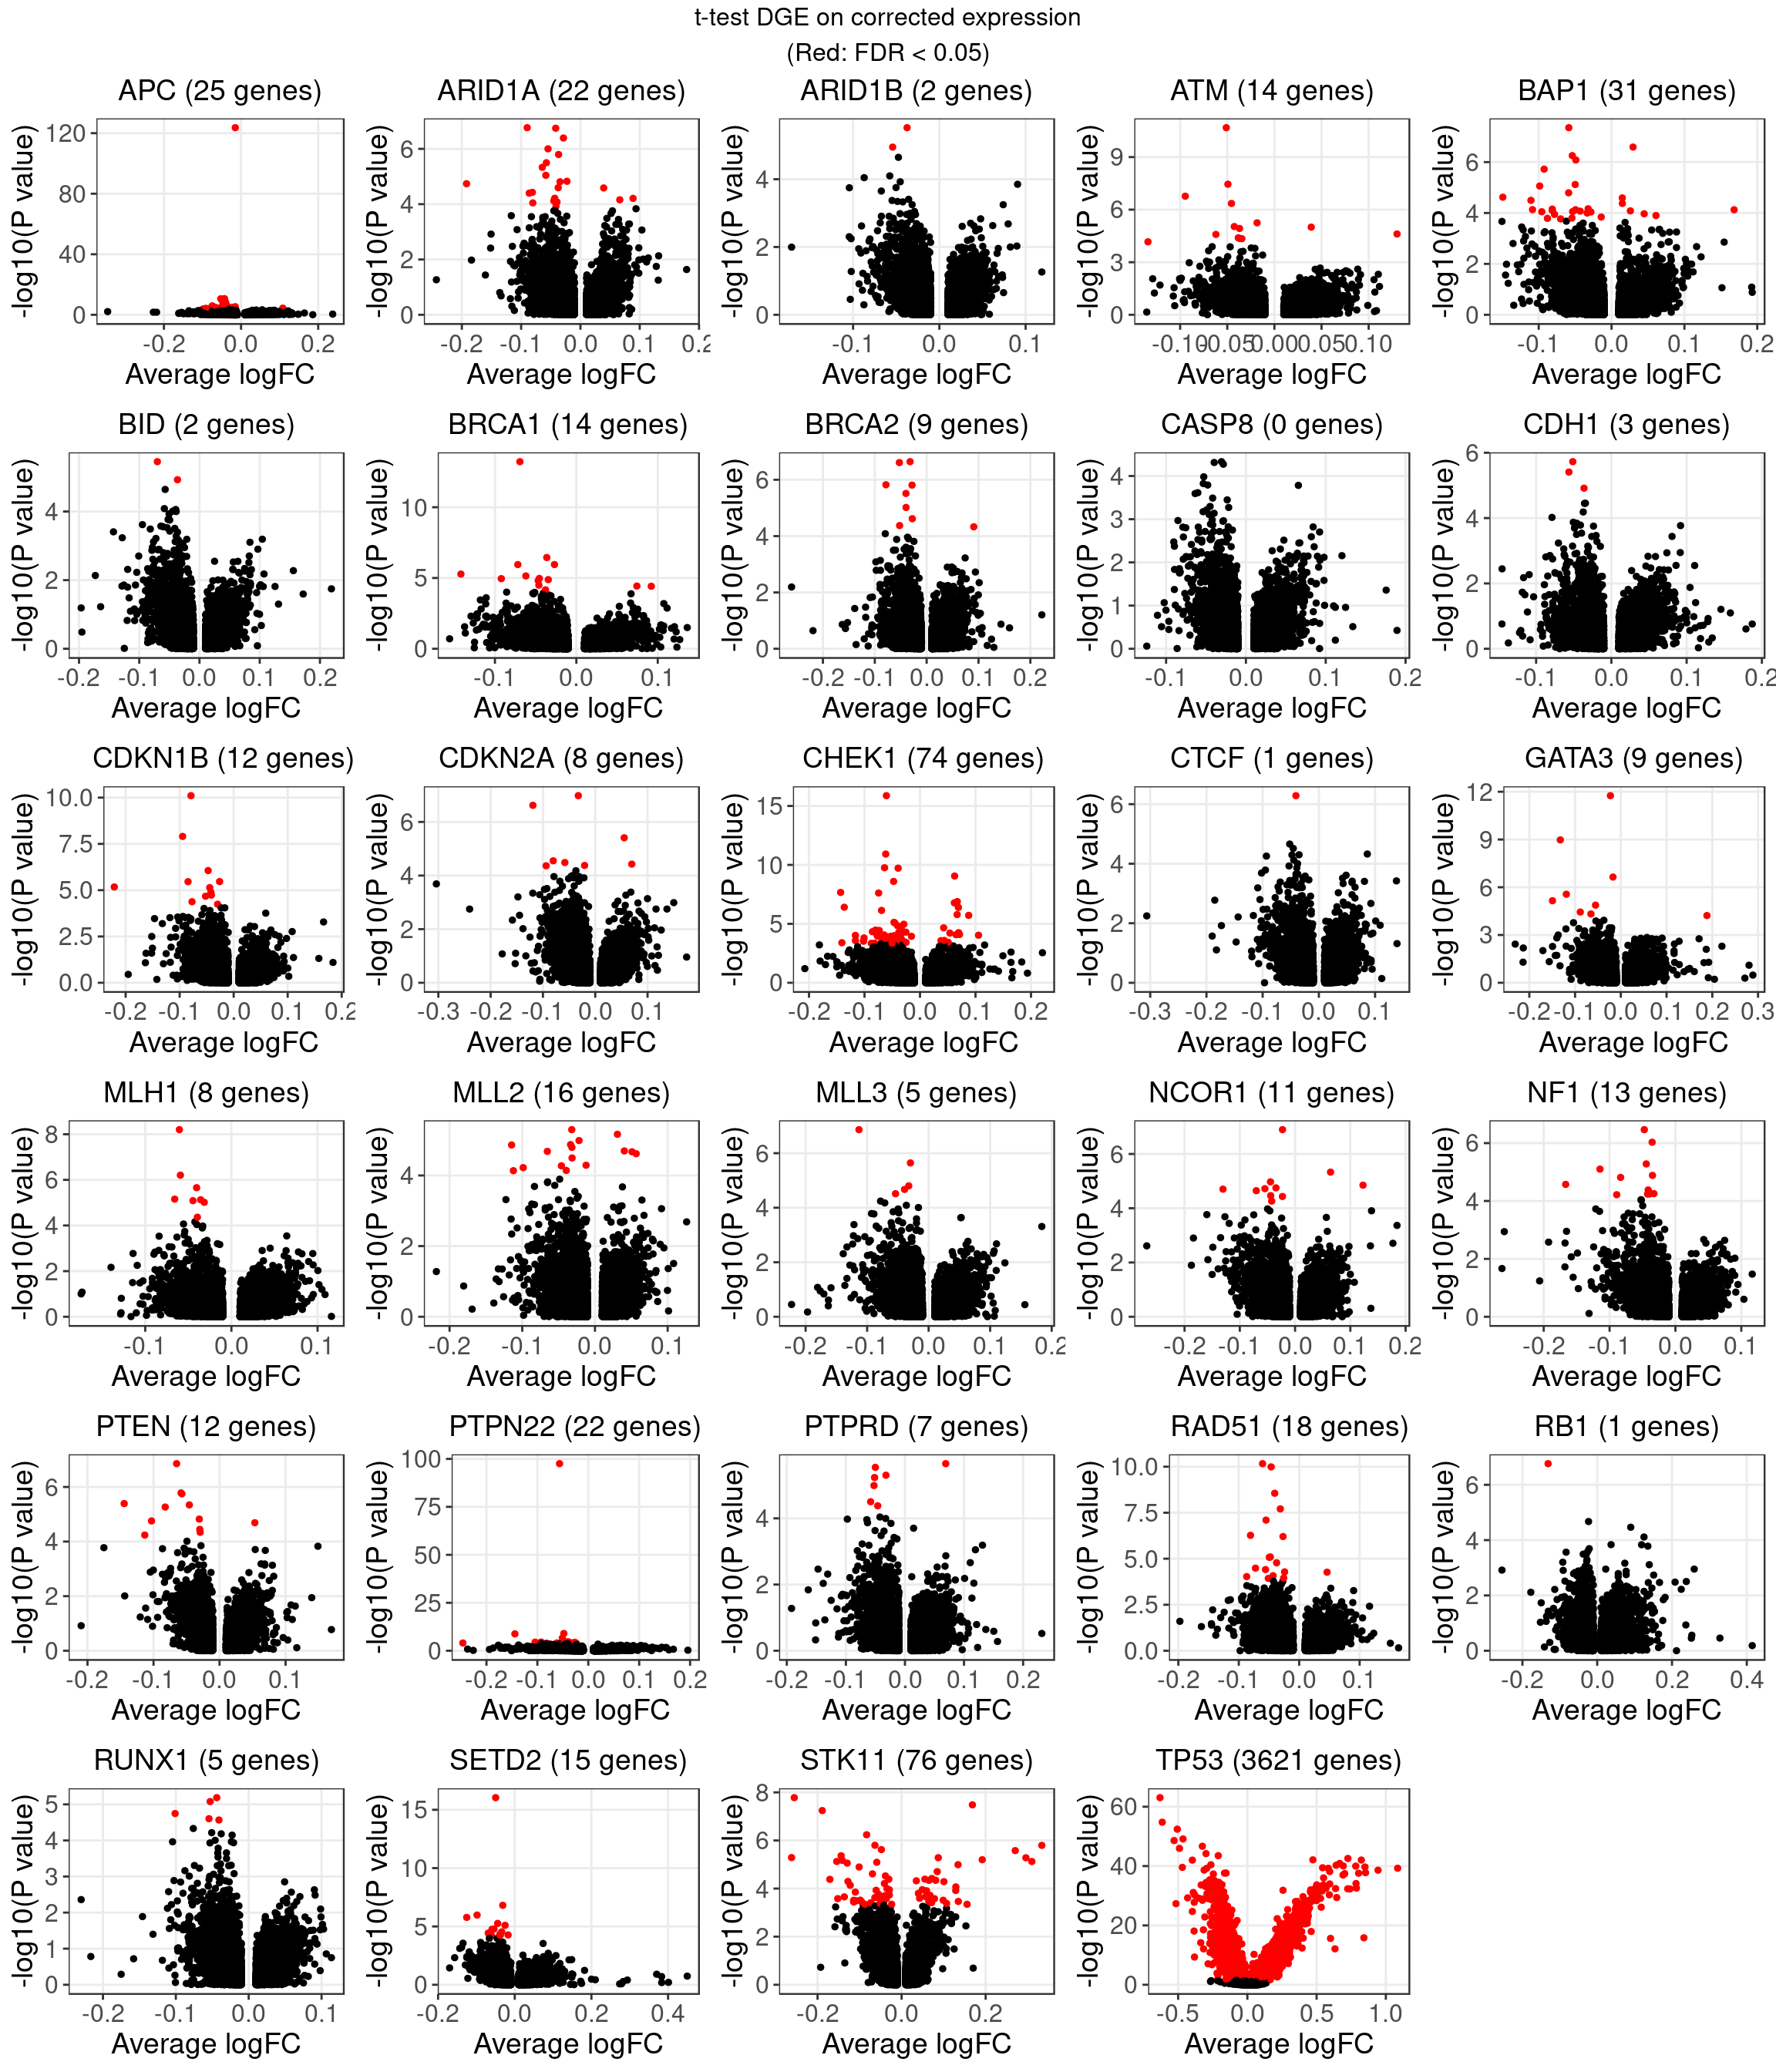
1.2 Welch’s t-test on corrected expression
The number of genes that passed an FDR threshold of 0.05 (Benjamini-Hochberg) under each KO condition is:
| KO | APC | ARID1A | ARID1B | ATM | BAP1 | BID | BRCA1 | BRCA2 | CASP8 | CDH1 |
| Num_genes | 25 | 22 | 2 | 14 | 31 | 2 | 14 | 9 | 0 | 3 |
| KO | CDKN1B | CDKN2A | CHEK1 | CTCF | GATA3 | MLH1 | MLL2 | MLL3 | NCOR1 | NF1 |
| Num_genes | 12 | 8 | 74 | 1 | 10 | 8 | 16 | 5 | 11 | 13 |
| KO | PTEN | PTPN22 | PTPRD | RAD51 | RB1 | RUNX1 | SETD2 | STK11 | TP53 | |
| Num_genes | 12 | 22 | 7 | 20 | 1 | 5 | 15 | 76 | 3649 | NA |
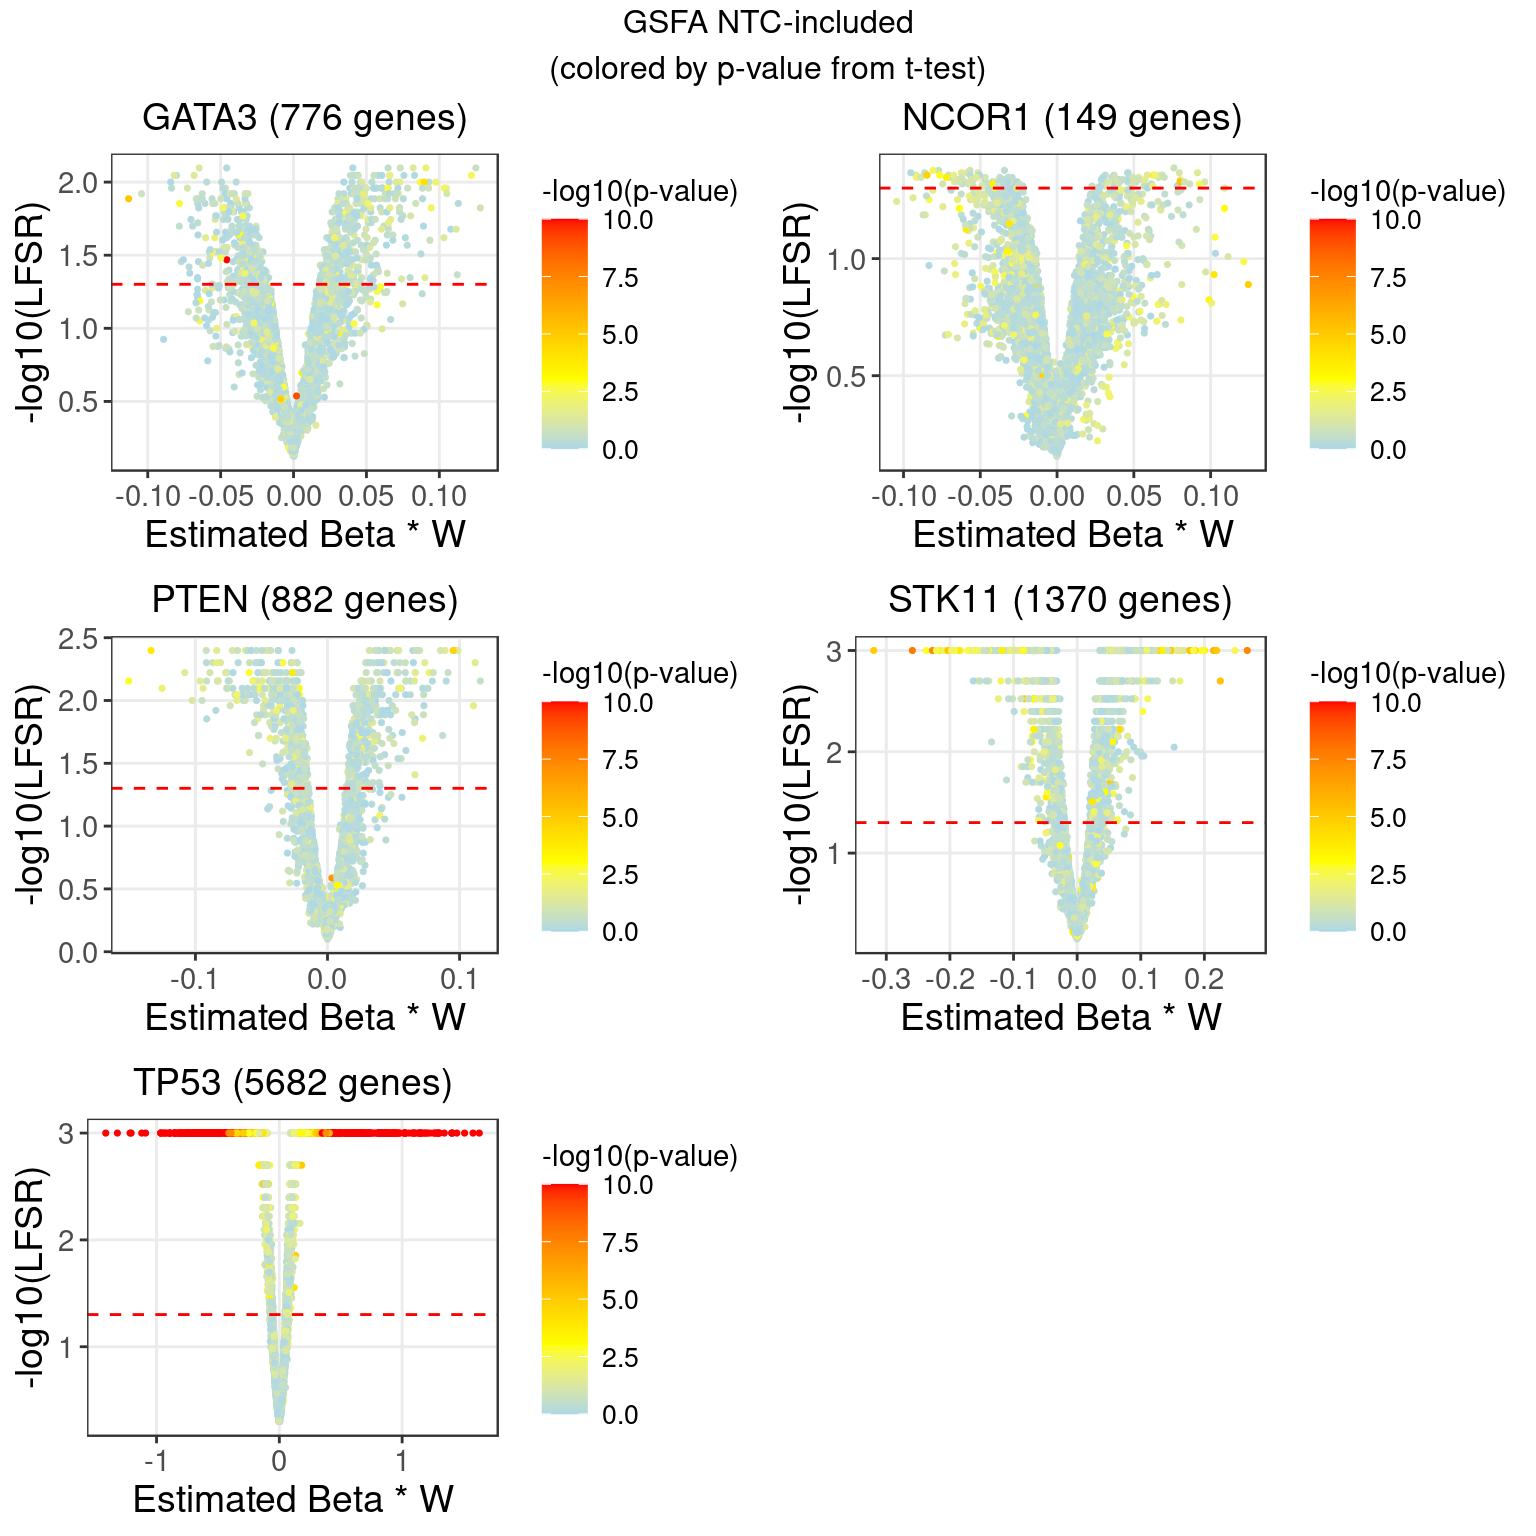
2 LFSR Estimation from GSFA (NTC condition regressed out, singletons)
In terms of our GSFA method, we can also determine if a KO condition has an significant effect on gene expression in the following way:
For a given GSFA inference result, we estimated the local false sign rate (lfsr) of a certain knock-out effect on each gene based on the posteriors of \(\beta\) and \(W\).
For gene \(j\) and KO condition \(m\), \[lfsr_{mj} = \text{min} \Big\{\text{Pr}(\sum_{k=1}^K \beta_{mk}W_{jk} \geq 0 \text{ | Data}), \text{Pr}(\sum_{k=1}^K \beta_{mk}W_{jk} \leq 0 \text{ | Data}) \Big\}\] Under each KO condition, the number of genes that pass a certain LFSR cutoff would be compared to that from a the DGE tests mentioned above.
| KO | APC | ARID1A | ARID1B | ATM | BAP1 | BID | BRCA1 | BRCA2 | CASP8 | CDH1 |
| Num_genes | 0 | 0 | 0 | 0 | 0 | 0 | 0 | 0 | 0 | 0 |
| KO | CDKN1B | CDKN2A | CHEK1 | CTCF | GATA3 | MLH1 | MLL2 | MLL3 | NCOR1 | NF1 |
| Num_genes | 0 | 0 | 0 | 0 | 776 | 0 | 0 | 0 | 149 | 0 |
| KO | PTEN | PTPN22 | PTPRD | RAD51 | RB1 | RUNX1 | SETD2 | STK11 | TP53 | |
| Num_genes | 882 | 0 | 0 | 0 | 0 | 0 | 0 | 1370 | 5682 | NA |
2.1 Comparison between NTC-regressed and Wilcoxon DGE (log-CPM) results
| KO | olap_num | dge_num | lfsr_num |
|---|---|---|---|
| APC | 0 | 1 | 0 |
| ARID1A | 0 | 2 | 0 |
| ARID1B | 0 | 1 | 0 |
| ATM | 0 | 0 | 0 |
| BAP1 | 0 | 0 | 0 |
| BID | 0 | 0 | 0 |
| BRCA1 | 0 | 1 | 0 |
| BRCA2 | 0 | 0 | 0 |
| CASP8 | 0 | 0 | 0 |
| CDH1 | 0 | 0 | 0 |
| CDKN1B | 0 | 0 | 0 |
| CDKN2A | 0 | 0 | 0 |
| CHEK1 | 0 | 0 | 0 |
| CTCF | 0 | 0 | 0 |
| GATA3 | 2 | 5 | 603 |
| MLH1 | 0 | 0 | 0 |
| MLL2 | 0 | 0 | 0 |
| MLL3 | 0 | 0 | 0 |
| NCOR1 | 1 | 9 | 127 |
| NF1 | 0 | 0 | 0 |
| PTEN | 1 | 1 | 655 |
| PTPN22 | 0 | 1 | 0 |
| PTPRD | 0 | 0 | 0 |
| RAD51 | 0 | 0 | 0 |
| RB1 | 0 | 176 | 0 |
| RUNX1 | 0 | 0 | 0 |
| SETD2 | 0 | 1 | 0 |
| STK11 | 99 | 151 | 1052 |
| TP53 | 4642 | 5510 | 5351 |
2.2 Comparison between NTC-regressed and DGE t-test (corrected) results
| KO | olap_num | dge_num | lfsr_num |
|---|---|---|---|
| APC | 0 | 25 | 0 |
| ARID1A | 0 | 22 | 0 |
| ARID1B | 0 | 2 | 0 |
| ATM | 0 | 14 | 0 |
| BAP1 | 0 | 31 | 0 |
| BID | 0 | 2 | 0 |
| BRCA1 | 0 | 14 | 0 |
| BRCA2 | 0 | 9 | 0 |
| CASP8 | 0 | 0 | 0 |
| CDH1 | 0 | 3 | 0 |
| CDKN1B | 0 | 12 | 0 |
| CDKN2A | 0 | 8 | 0 |
| CHEK1 | 0 | 74 | 0 |
| CTCF | 0 | 1 | 0 |
| GATA3 | 3 | 10 | 776 |
| MLH1 | 0 | 8 | 0 |
| MLL2 | 0 | 16 | 0 |
| MLL3 | 0 | 5 | 0 |
| NCOR1 | 2 | 11 | 149 |
| NF1 | 0 | 13 | 0 |
| PTEN | 3 | 12 | 882 |
| PTPN22 | 0 | 22 | 0 |
| PTPRD | 0 | 7 | 0 |
| RAD51 | 0 | 20 | 0 |
| RB1 | 0 | 1 | 0 |
| RUNX1 | 0 | 5 | 0 |
| SETD2 | 0 | 15 | 0 |
| STK11 | 50 | 76 | 1370 |
| TP53 | 3576 | 3649 | 5682 |
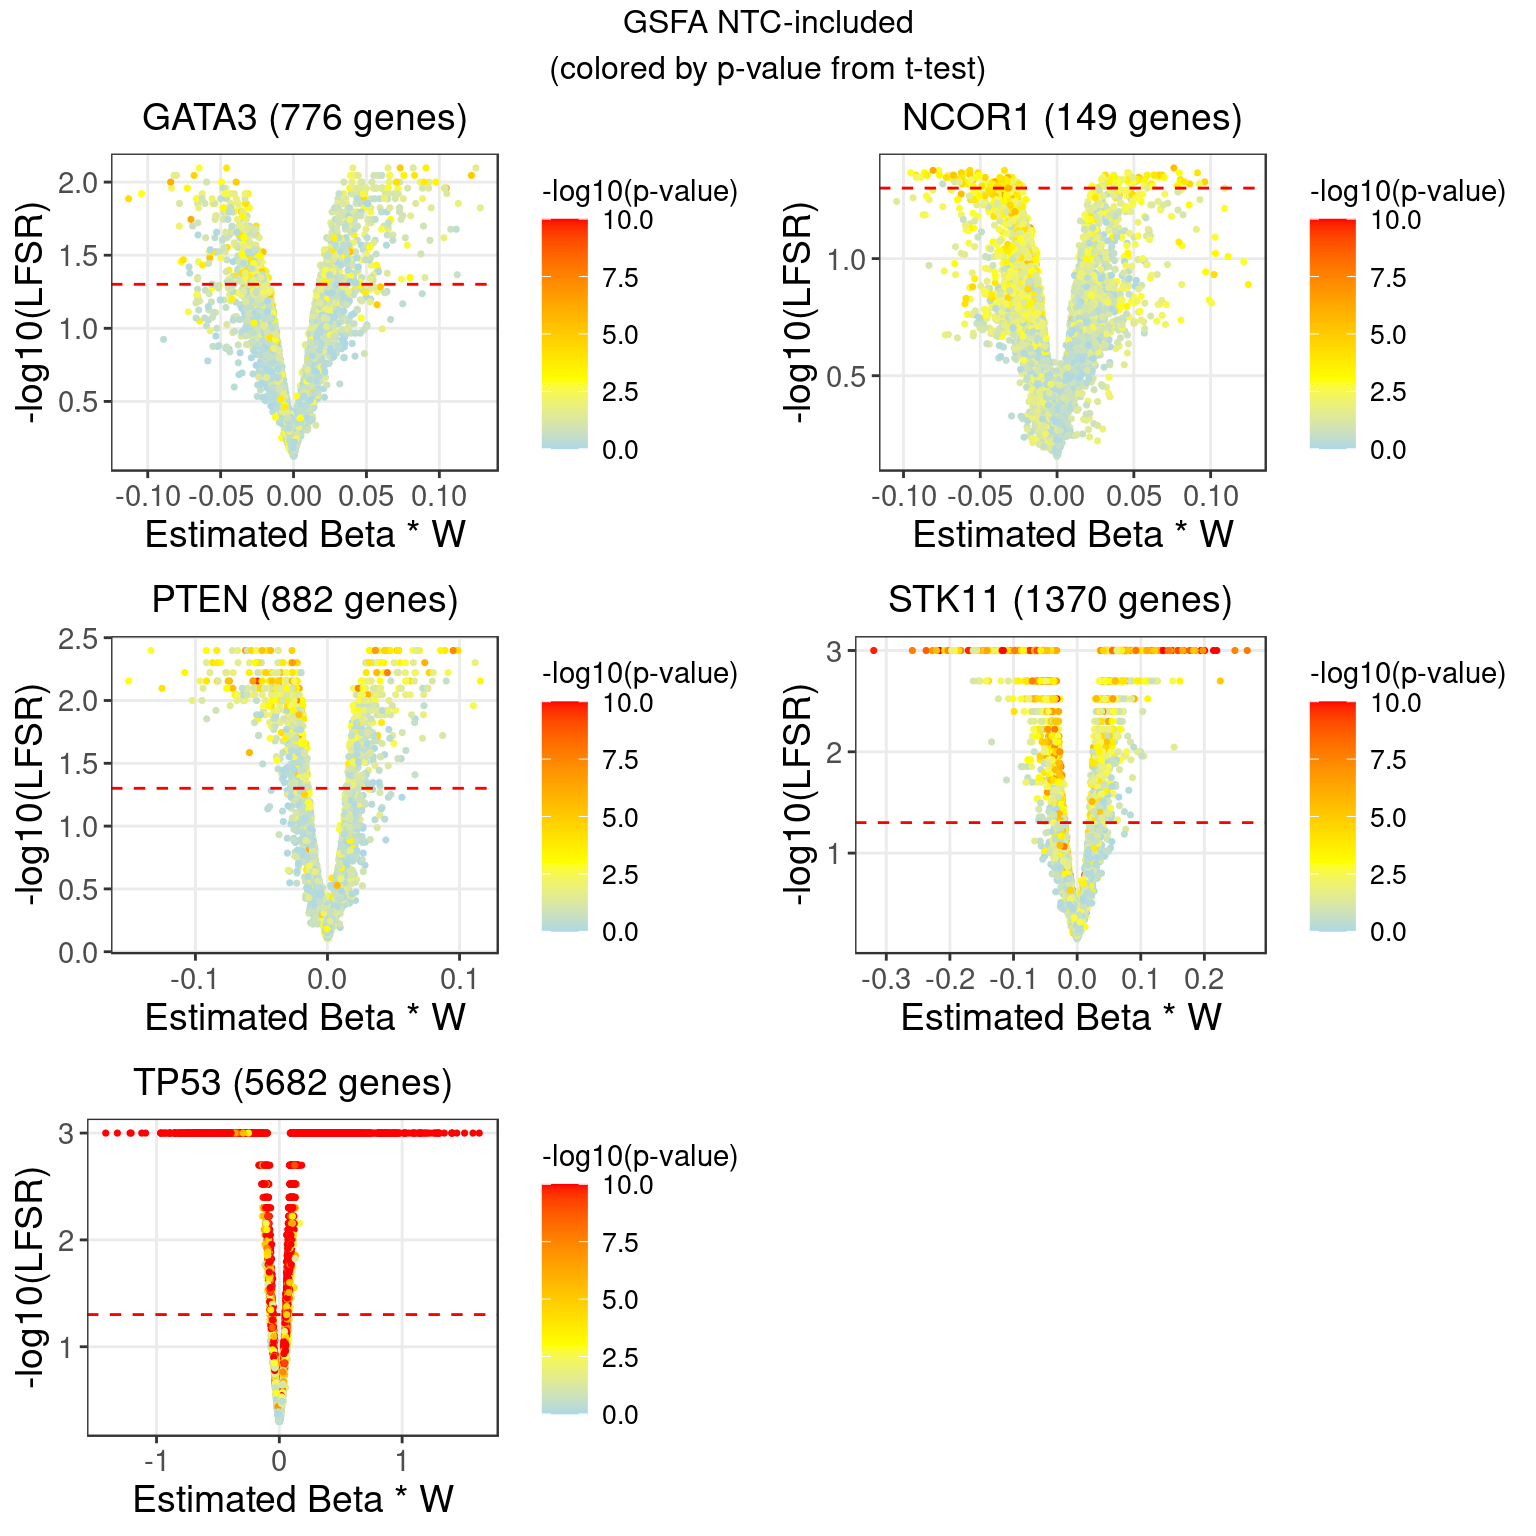
2.3 GSFA estimated effect size vs LFSR
2.3.1 Compared to DGE on input Y
To understand why t-test on the input matrix, \(Y\), for GSFA still found much fewer genes than LFSR from factor analysis, we consider the factors that are significantly associated with each guide. We have 2 possible assumptions:
The top factors captured by GSFA (i.e. \(ZW^T\)) might increase gene association with guide.
The residuals of \(Y\) after regressing out non-relevant factors (i.e. \(\text{resid} (Y \sim Z_{l \in \{\hat\beta_l = 0\}})\)) might increase gene association with guide.
2.3.2 DGE p values on \(ZW^T\)
2.3.3 DGE p values on residuals of Y after associated modules were regressed out
Knock-down gene: GATA3 Associated factors: 7,11
Knock-down gene: NCOR1 Associated factors: 8
Knock-down gene: PTEN Associated factors: 13
Knock-down gene: STK11 Associated factors: 13,17,19
Knock-down gene: TP53 Associated factors: 1,2,3,5,6,7,8,9,11,12,13,15,20
