1 Data Settings
CROP-seq data source:
On the design of CRISPR-based single cell molecular screens, GEO accession: GSE108699.
Cells:
MCF10A cells (normal human breast epithelial cells) with exposure to a DNA damaging agent, doxorubicin;
Perturbations:
CRISPR knock-outs of 29 tumor-suppressor genes (TP53, …), 1 non-targeting control.
1.1 Doxorubicin-treated expression data
There are 5584 cells with nonzero gRNA count.
1.2 Perturbations
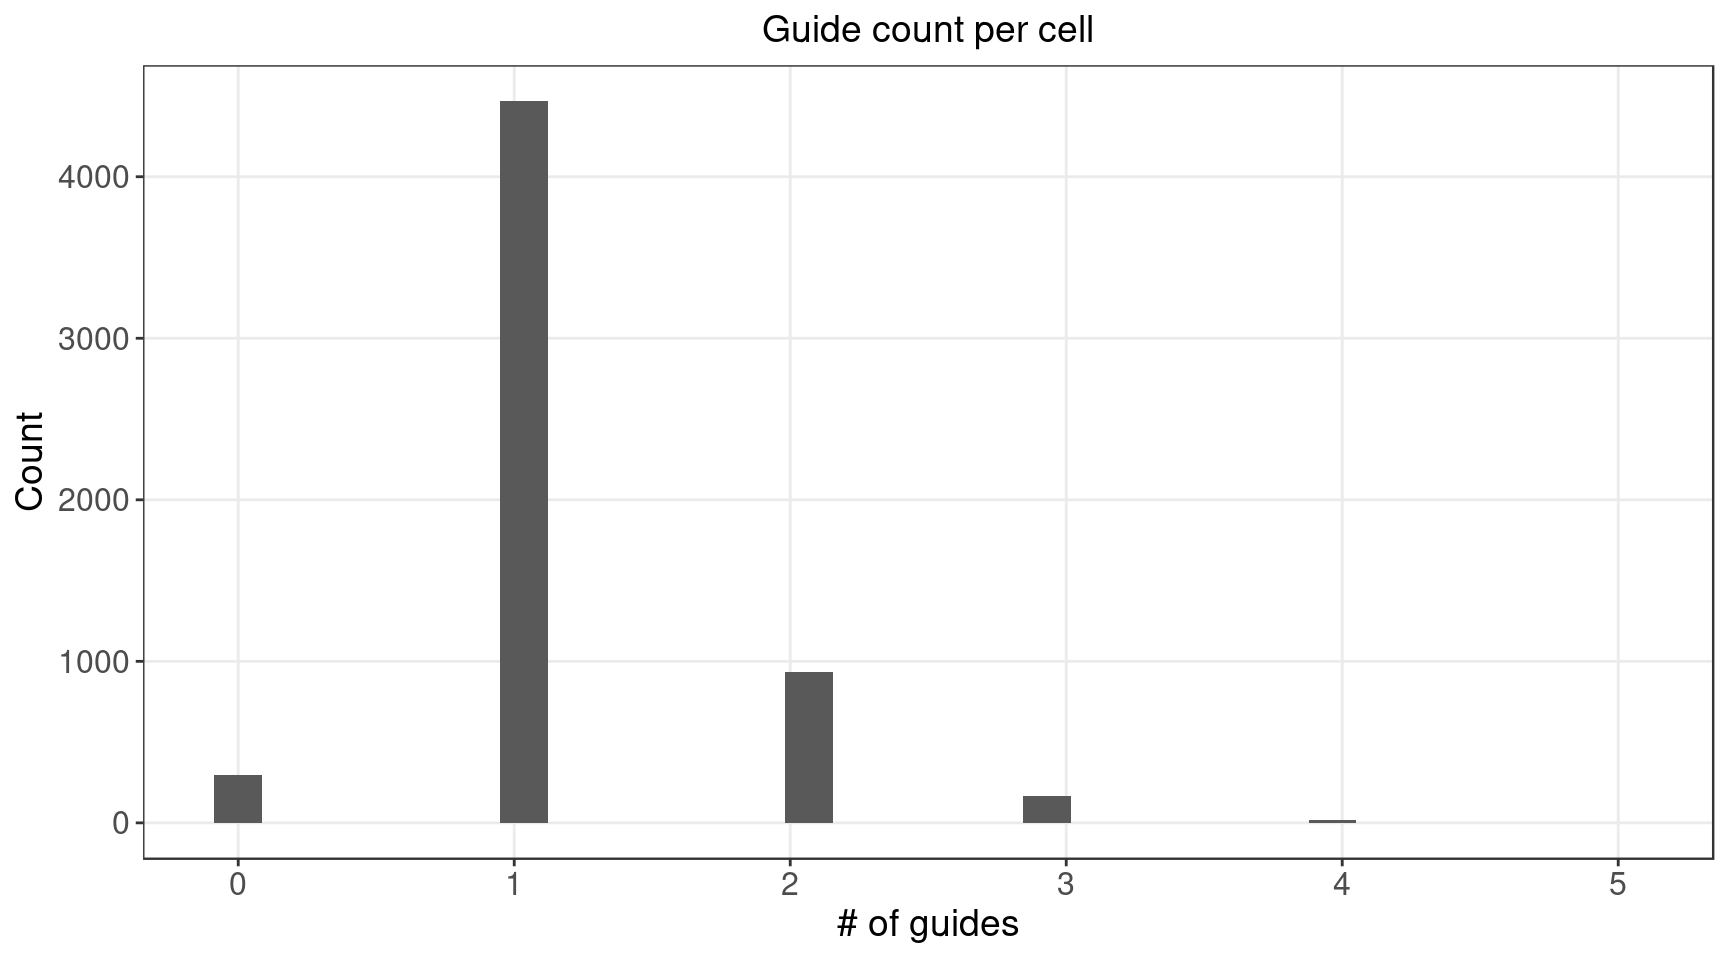
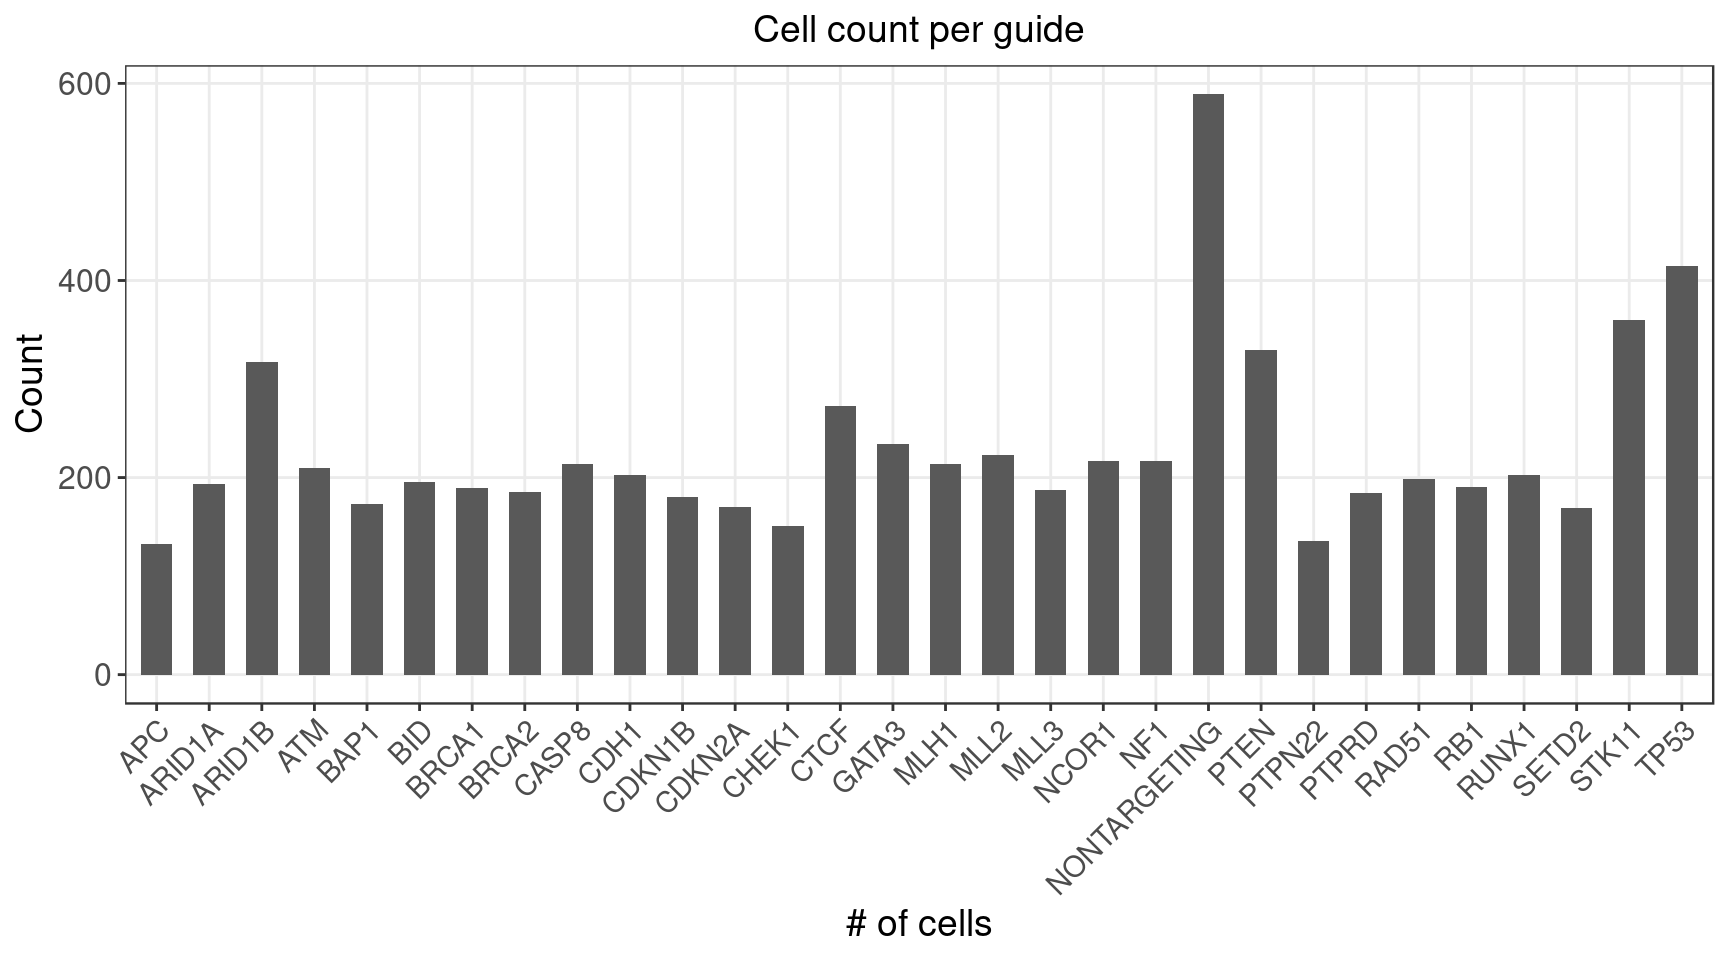
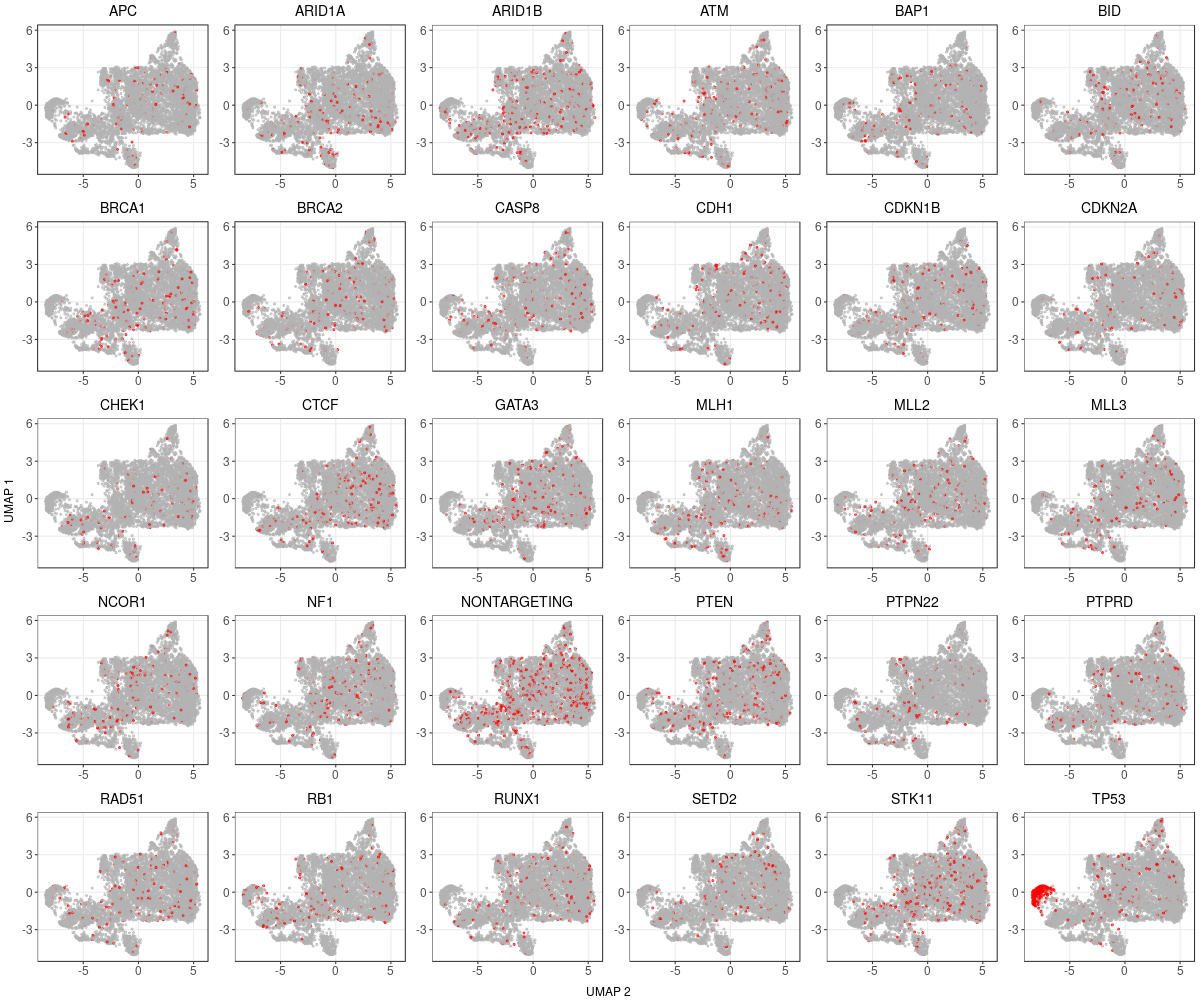
1.2.1 Distribution of Knock-out Perturbations
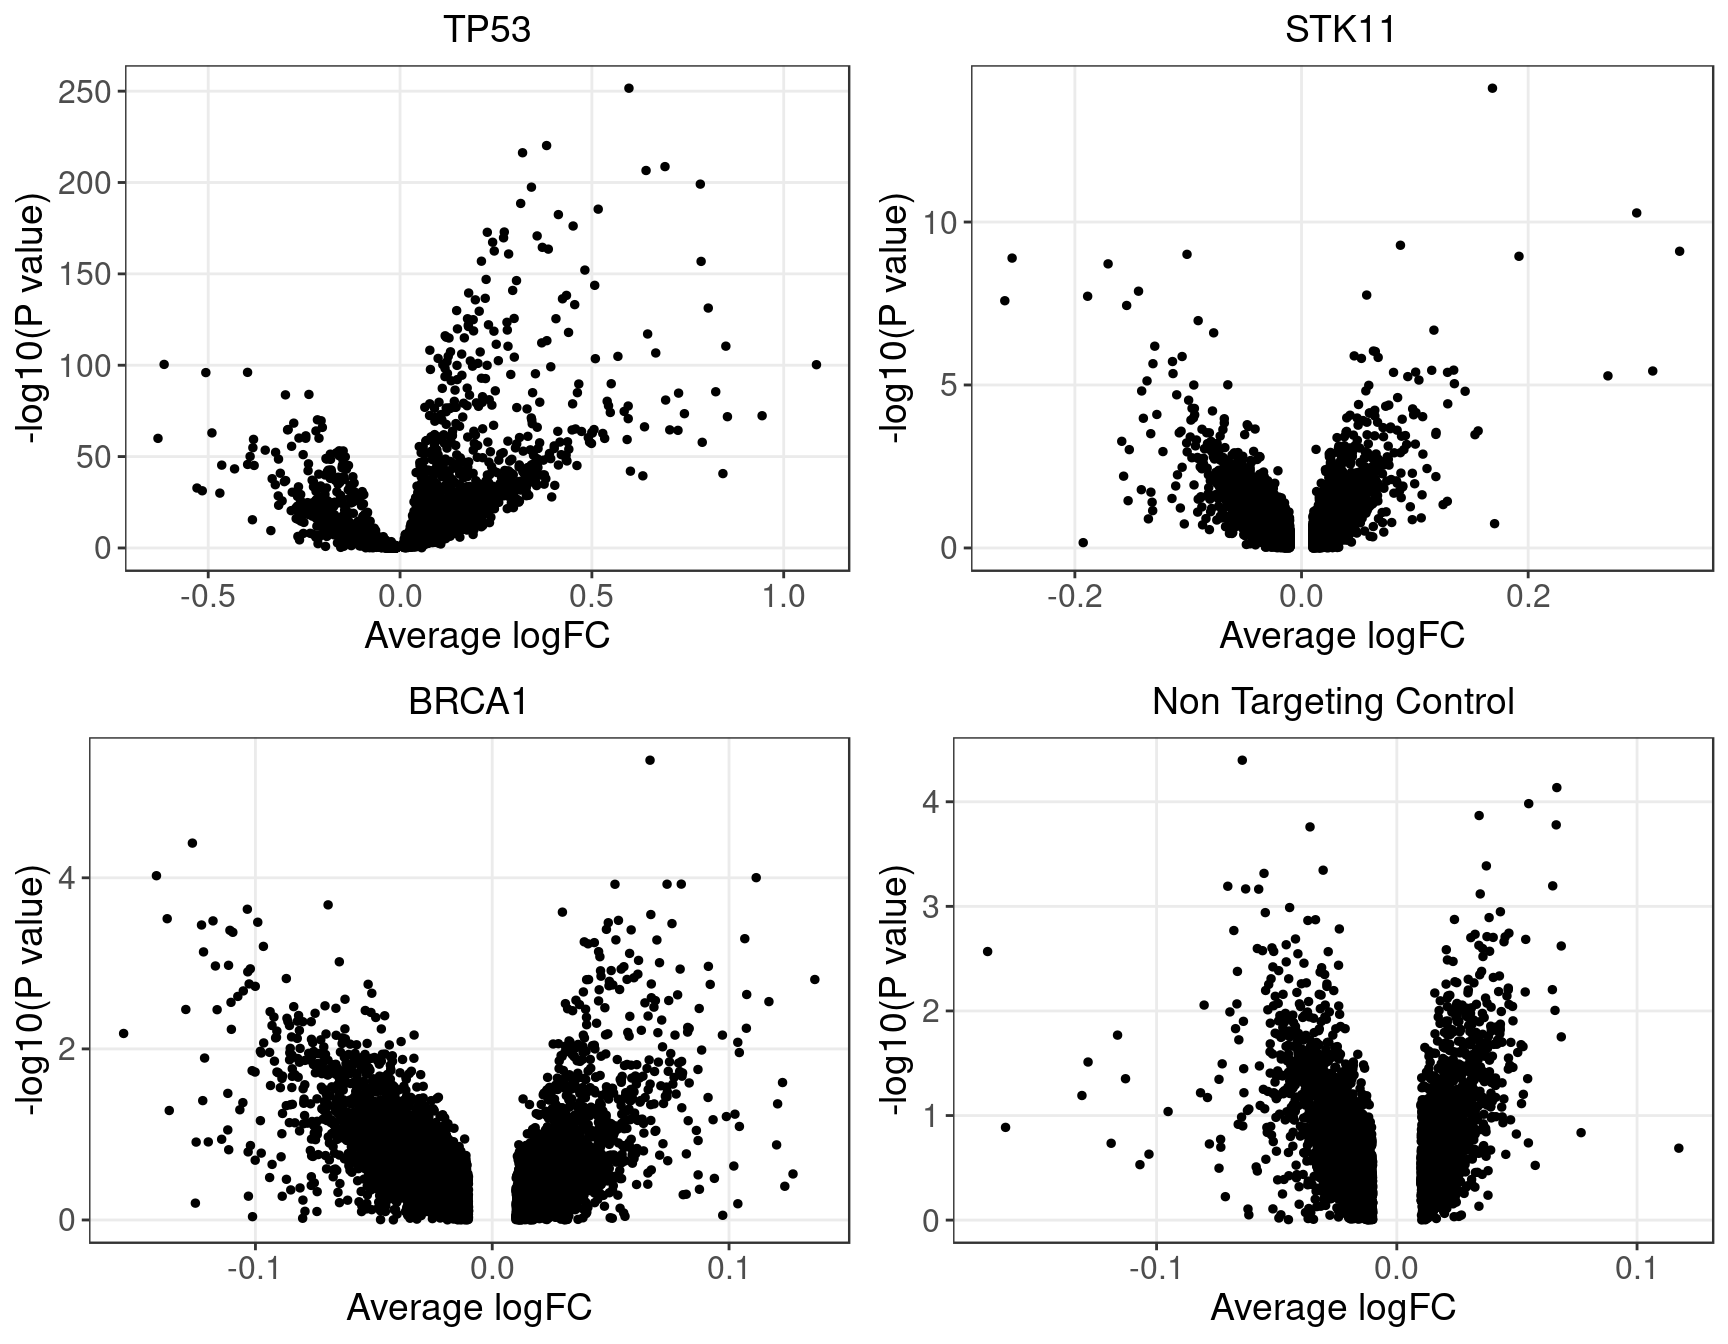
1.2.2 Wilcoxon Differential Expression Test
Number of genes that passed pval_adjust < 0.2 under each perturbation:| KO | APC | ARID1A | ARID1B | ATM | BAP1 | BID | BRCA1 | BRCA2 | CASP8 | CDH1 |
| DE_genes | 1 | 1 | 1 | 0 | 0 | 0 | 1 | 0 | 0 | 0 |
| KO | CDKN1B | CDKN2A | CHEK1 | CTCF | GATA3 | MLH1 | MLL2 | MLL3 | NCOR1 | NF1 |
| DE_genes | 0 | 0 | 0 | 0 | 0 | 0 | 0 | 0 | 1 | 0 |
| KO | NONTARGETING | PTEN | PTPN22 | PTPRD | RAD51 | RB1 | RUNX1 | SETD2 | STK11 | TP53 |
| DE_genes | 0 | 1 | 1 | 1 | 1 | 33 | 0 | 1 | 34 | 3476 |
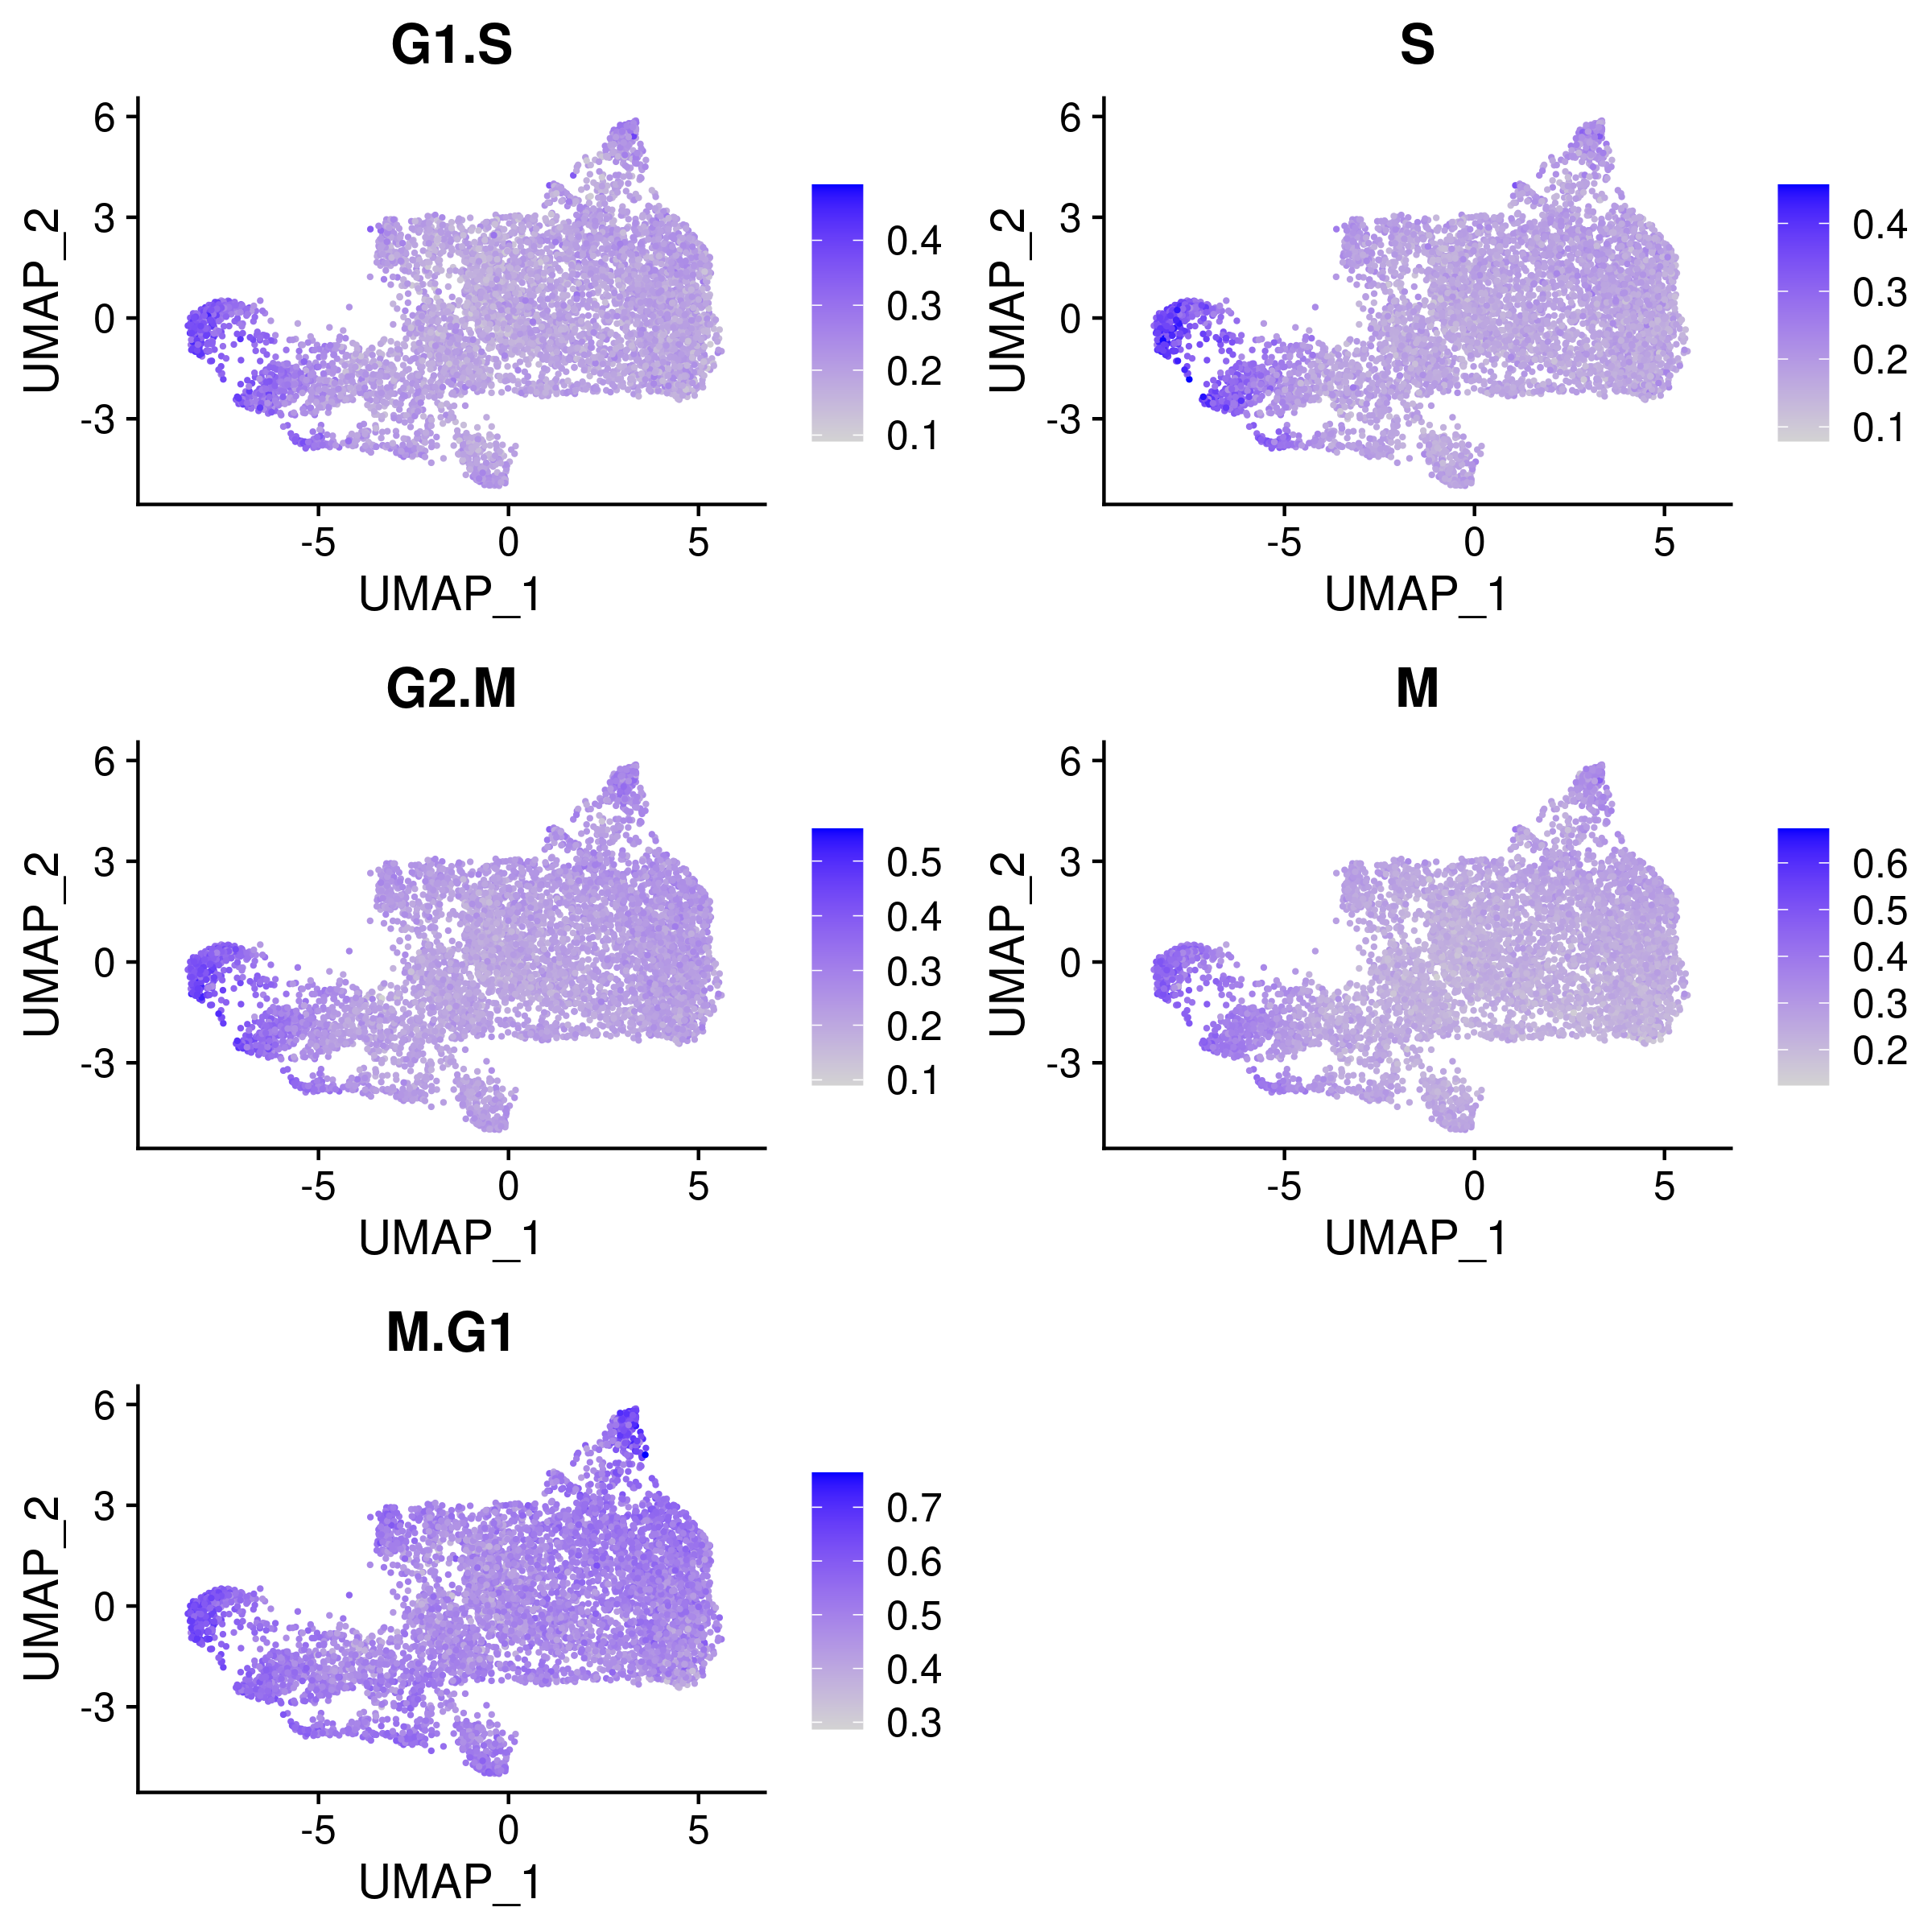
1.3 Potential confounding factors
Positive correlation between number of guides and cell library size: 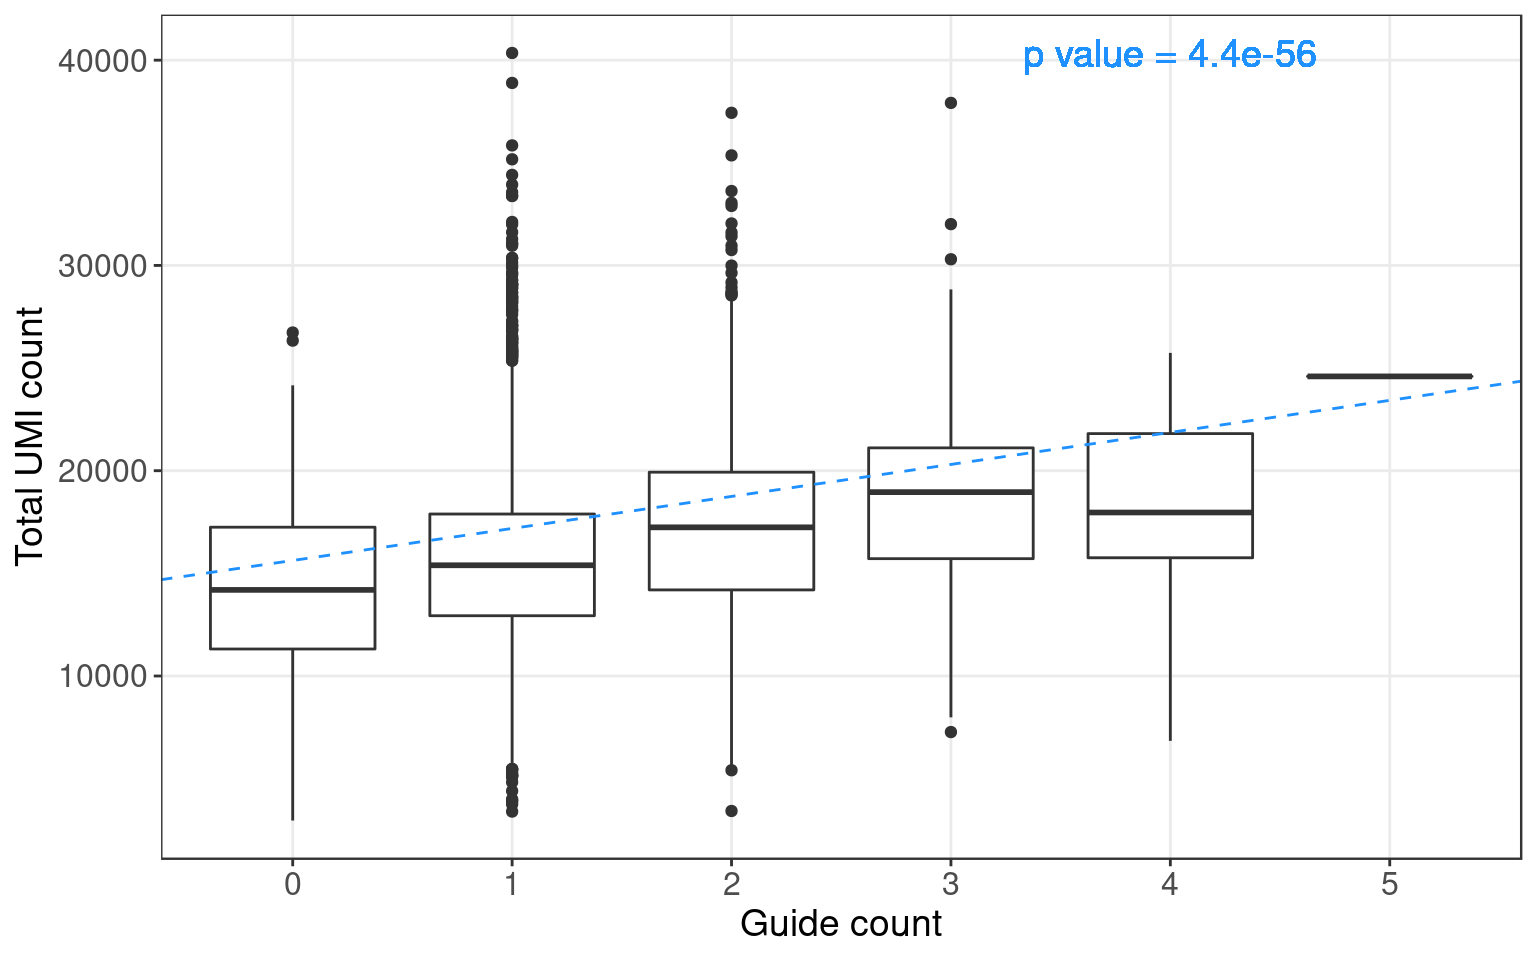
Cell cycle effects (colored by the mean expression of signature genes at the corresponding cell cycle stage):
1.4 Preprocessing of RNA count matrix
Seurat “LogNormalize”: log(count per \(10^4\) + 1).
Library size was regressed out, and the residuals were used as input.
Only cells with gRNA readout and genes detected in > 10% of cells were kept.