Guided Factor Analysis on Stimulated T Cell CROP-seq Data
– 2 donors pooled, batch effect and 3 other covariates corrected
Yifan Zhou (zhouyf@uchicago.edu)
2021-04-01
1 Single cell expression data
Source:
Genome-wide CRISPR Screens in Primary Human T Cells Reveal Key Regulators of Immune Function, GEO accession: GSE119450.
Perturbations:
CRISPR knock-out of 20 genes (2 gRNAs per gene) + 8 non-targeting gRNAs. Guide conditions were defined on the target gene level; target genes were either found to regulate T cell responses in the genome-wide screens, or known checkpoint genes.
Guide RNAs were introduced into T cells through a novel procedure called sgRNA lentiviral infection with Cas9 protein electroporation (SLICE).
Cells:
Primary human CD8+ T cells from two healthy donors, with T cell receptor (TCR) stimulation.
Cells from 2 donors were pooled together into 1 analysis. All cells have only a single type of gRNA readout. Quality control resulted in 13983 cells.
Genes:
Only genes detected in > 10% of cells were kept, resulted in 6062 genes.
Normalization:
Seurat “LogNormalize”: log(count per 10K + 1).
Batch effect, unique UMI count, library size, and mitochondria percentage were all corrected for. The corrected and scaled expression data were used as input for subsequent factor analysis.
2 Guided results
Here, our “guide”, \(G\) matrix, consists of 21 types (20 genes + negative control) of KO conditions across cells.
In each case, Gibbs sampling was conducted for 2000 iterations, and the posterior mean estimates were averaged over the last 500 iterations.
2.1 SVD Initialization
2.1.1 Local False Sign Rate (LFSR)
For a given GSFA inference result, we can estimate the effect a certain KO condition \(m\) has on the expression of gene \(j\) by computing the LFSR of \(\beta_{m\cdot} \cdot W_{j\cdot}\).
Number of genes that passed GSFA LFSR < 0.05 under each perturbation:| KO | ARID1A | BTLA | C10orf54 | CBLB | CD3D | CD5 | CDKN1B |
| Num_genes | 499 | 0 | 0 | 2484 | 1238 | 1264 | 0 |
| KO | DGKA | DGKZ | HAVCR2 | LAG3 | LCP2 | MEF2D | NonTarget |
| Num_genes | 461 | 0 | 0 | 0 | 3194 | 0 | 0 |
| KO | PDCD1 | RASA2 | SOCS1 | STAT6 | TCEB2 | TMEM222 | TNFRSF9 |
| Num_genes | 0 | 939 | 0 | 0 | 1758 | 0 | 0 |
| KO | ARID1A | BTLA | C10orf54 | CBLB | CD3D | CD5 | CDKN1B |
| Num_genes | 14 | 0 | 0 | 15 | 5 | 6 | 1 |
| KO | DGKA | DGKZ | HAVCR2 | LAG3 | LCP2 | MEF2D | NonTarget |
| Num_genes | 0 | 0 | 0 | 1 | 39 | 0 | 0 |
| KO | PDCD1 | RASA2 | SOCS1 | STAT6 | TCEB2 | TMEM222 | TNFRSF9 |
| Num_genes | 0 | 9 | 0 | 5 | 73 | 0 | 1 |
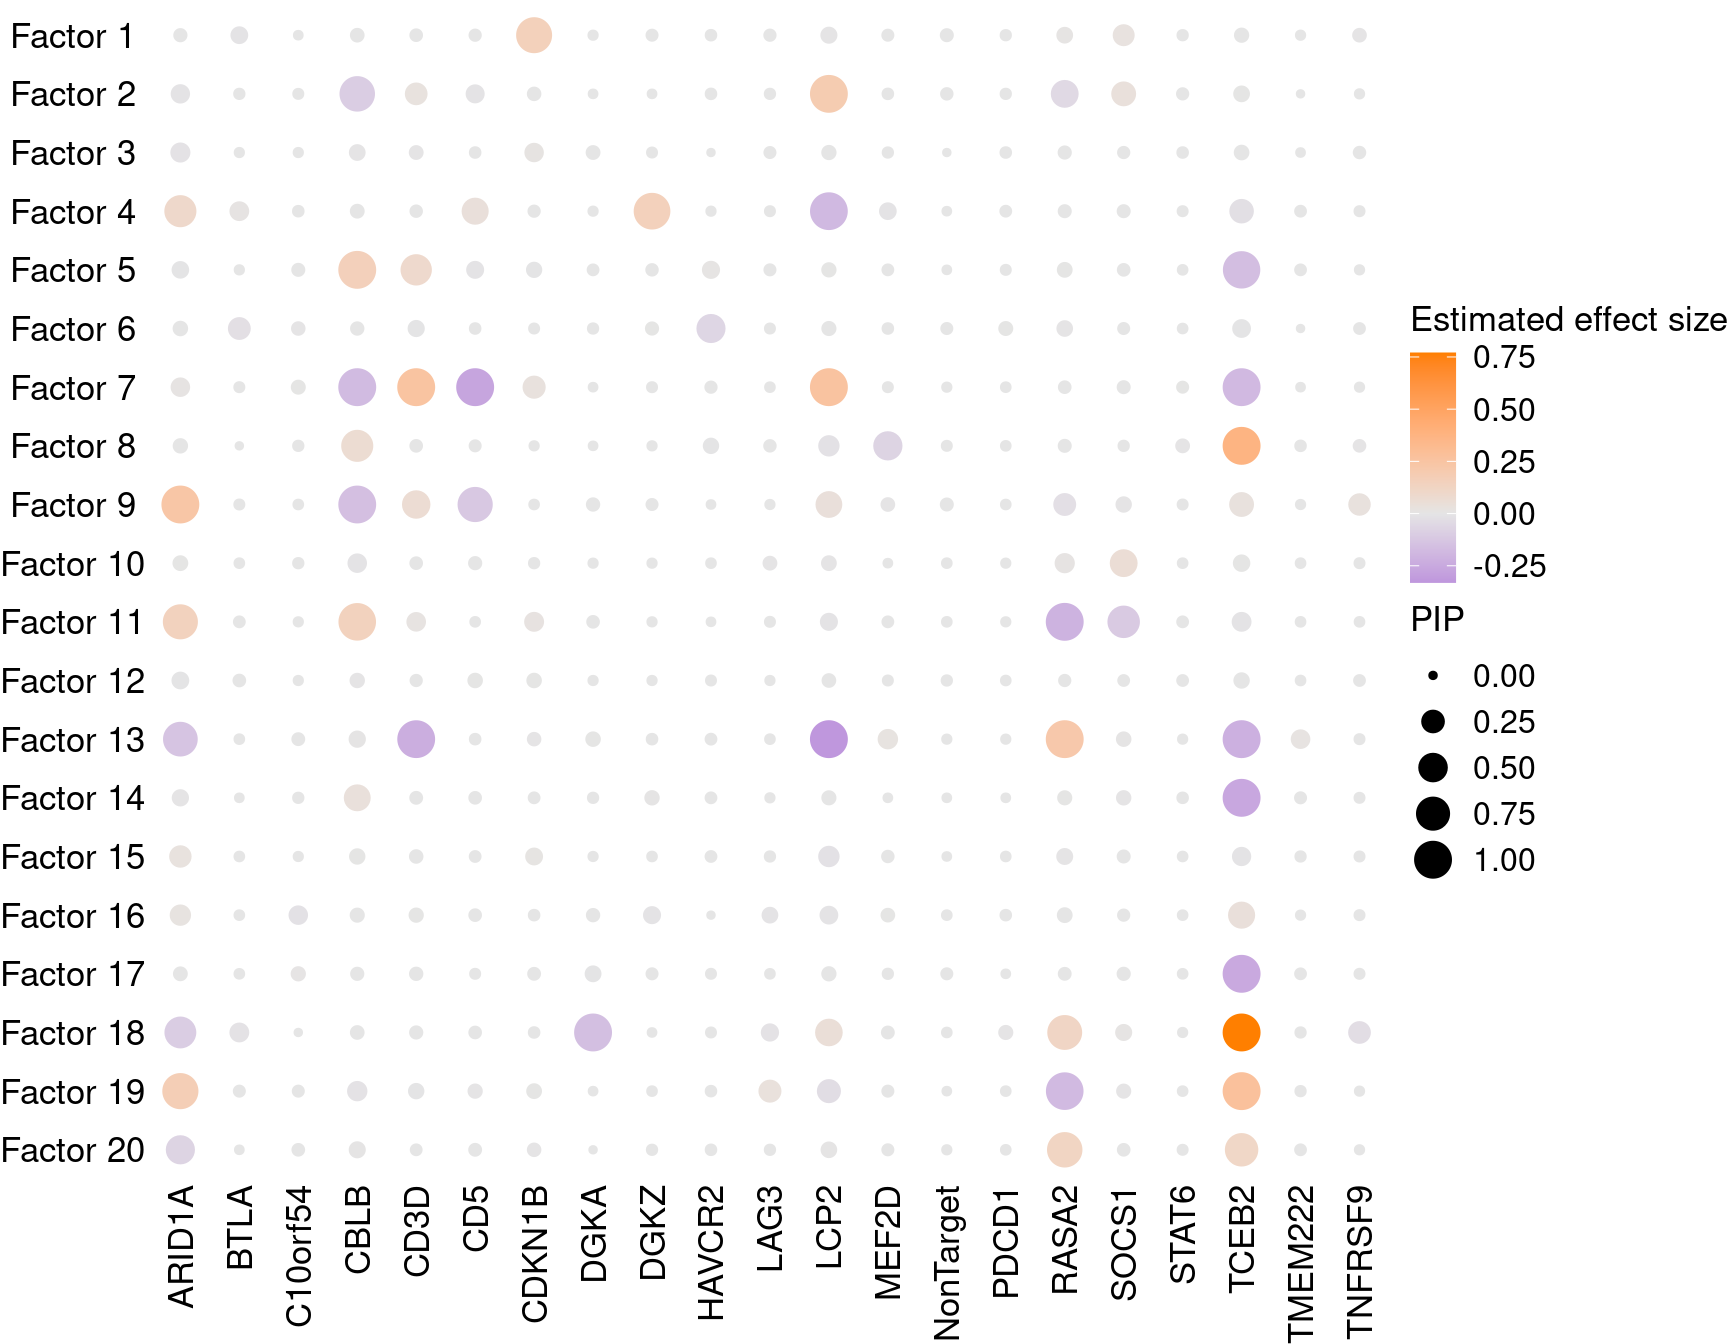
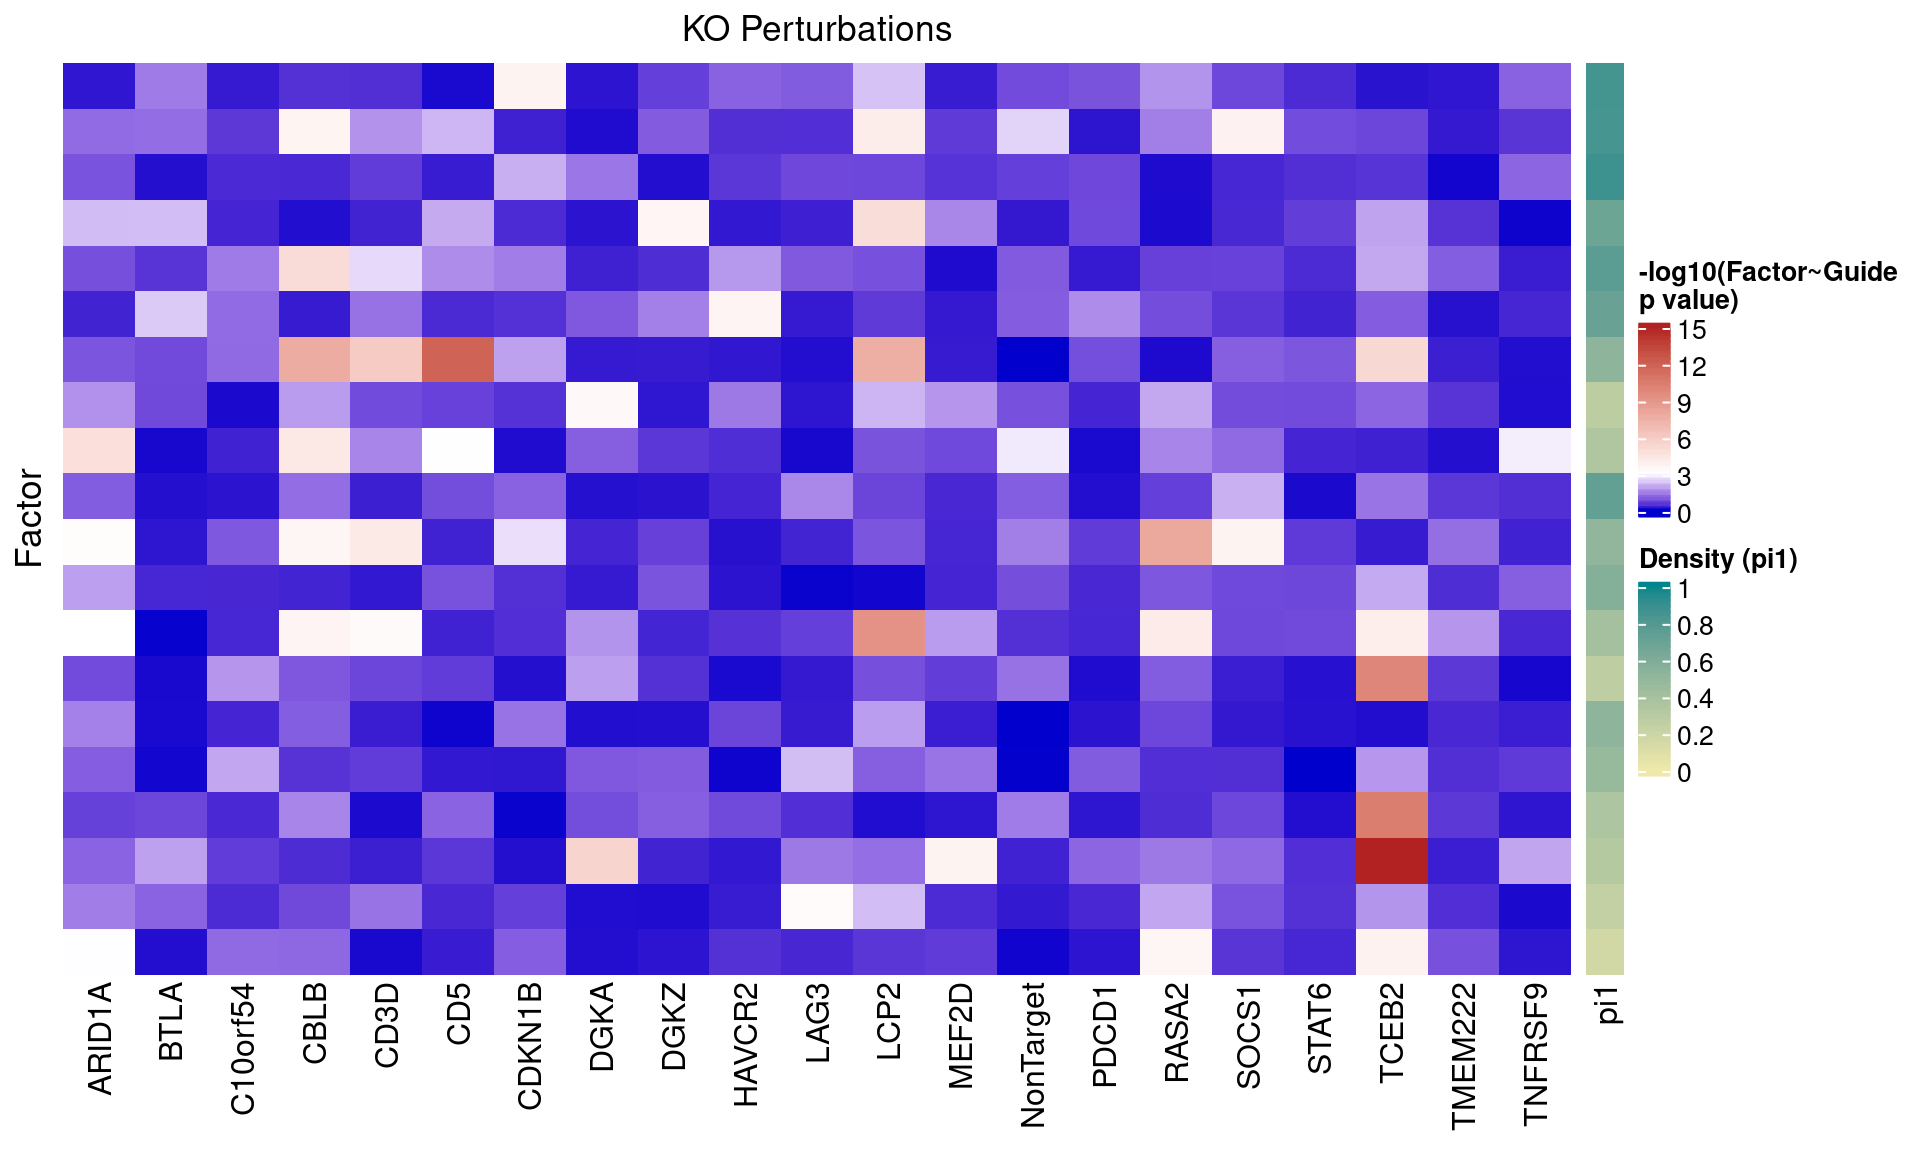
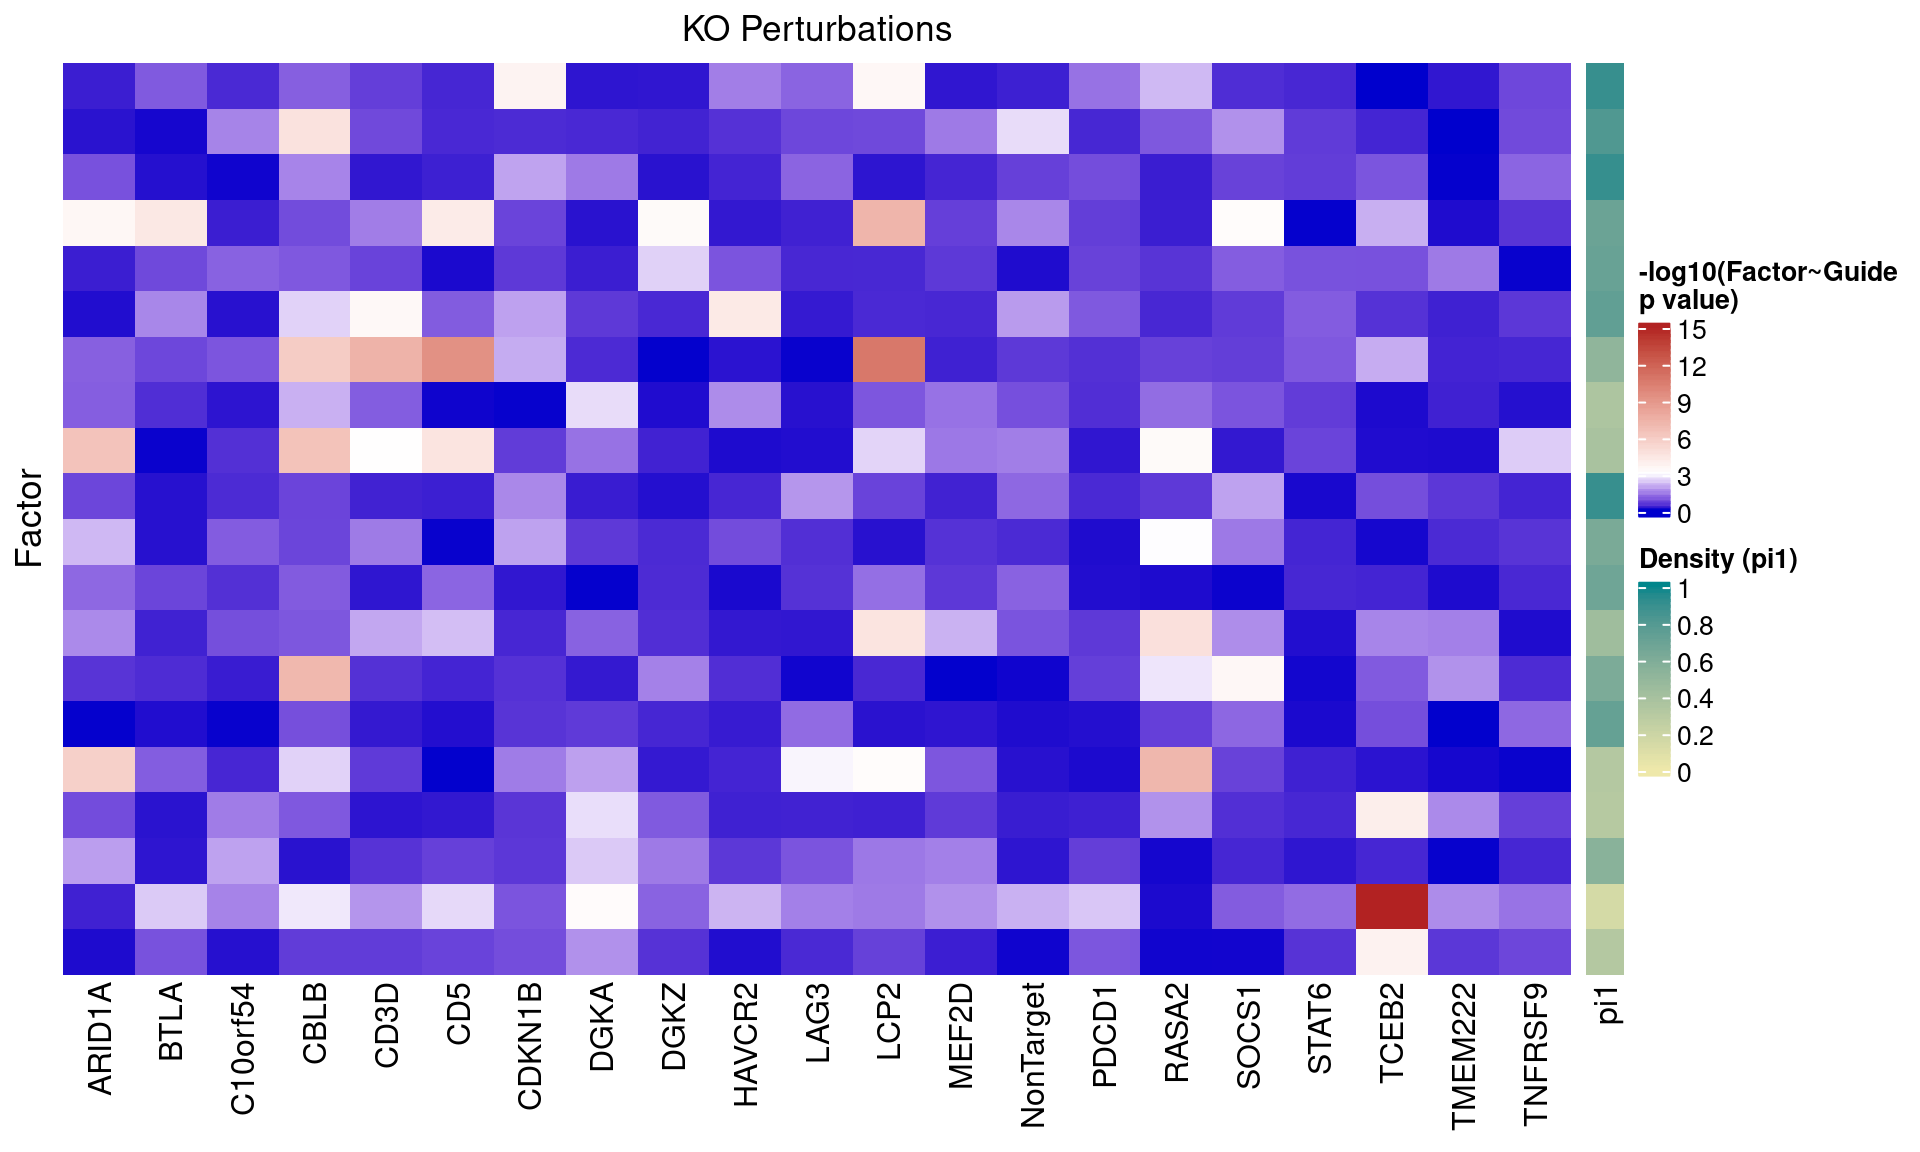
2.1.2 Estimate of Factor ~ Perturbation Associations (\(\beta\))
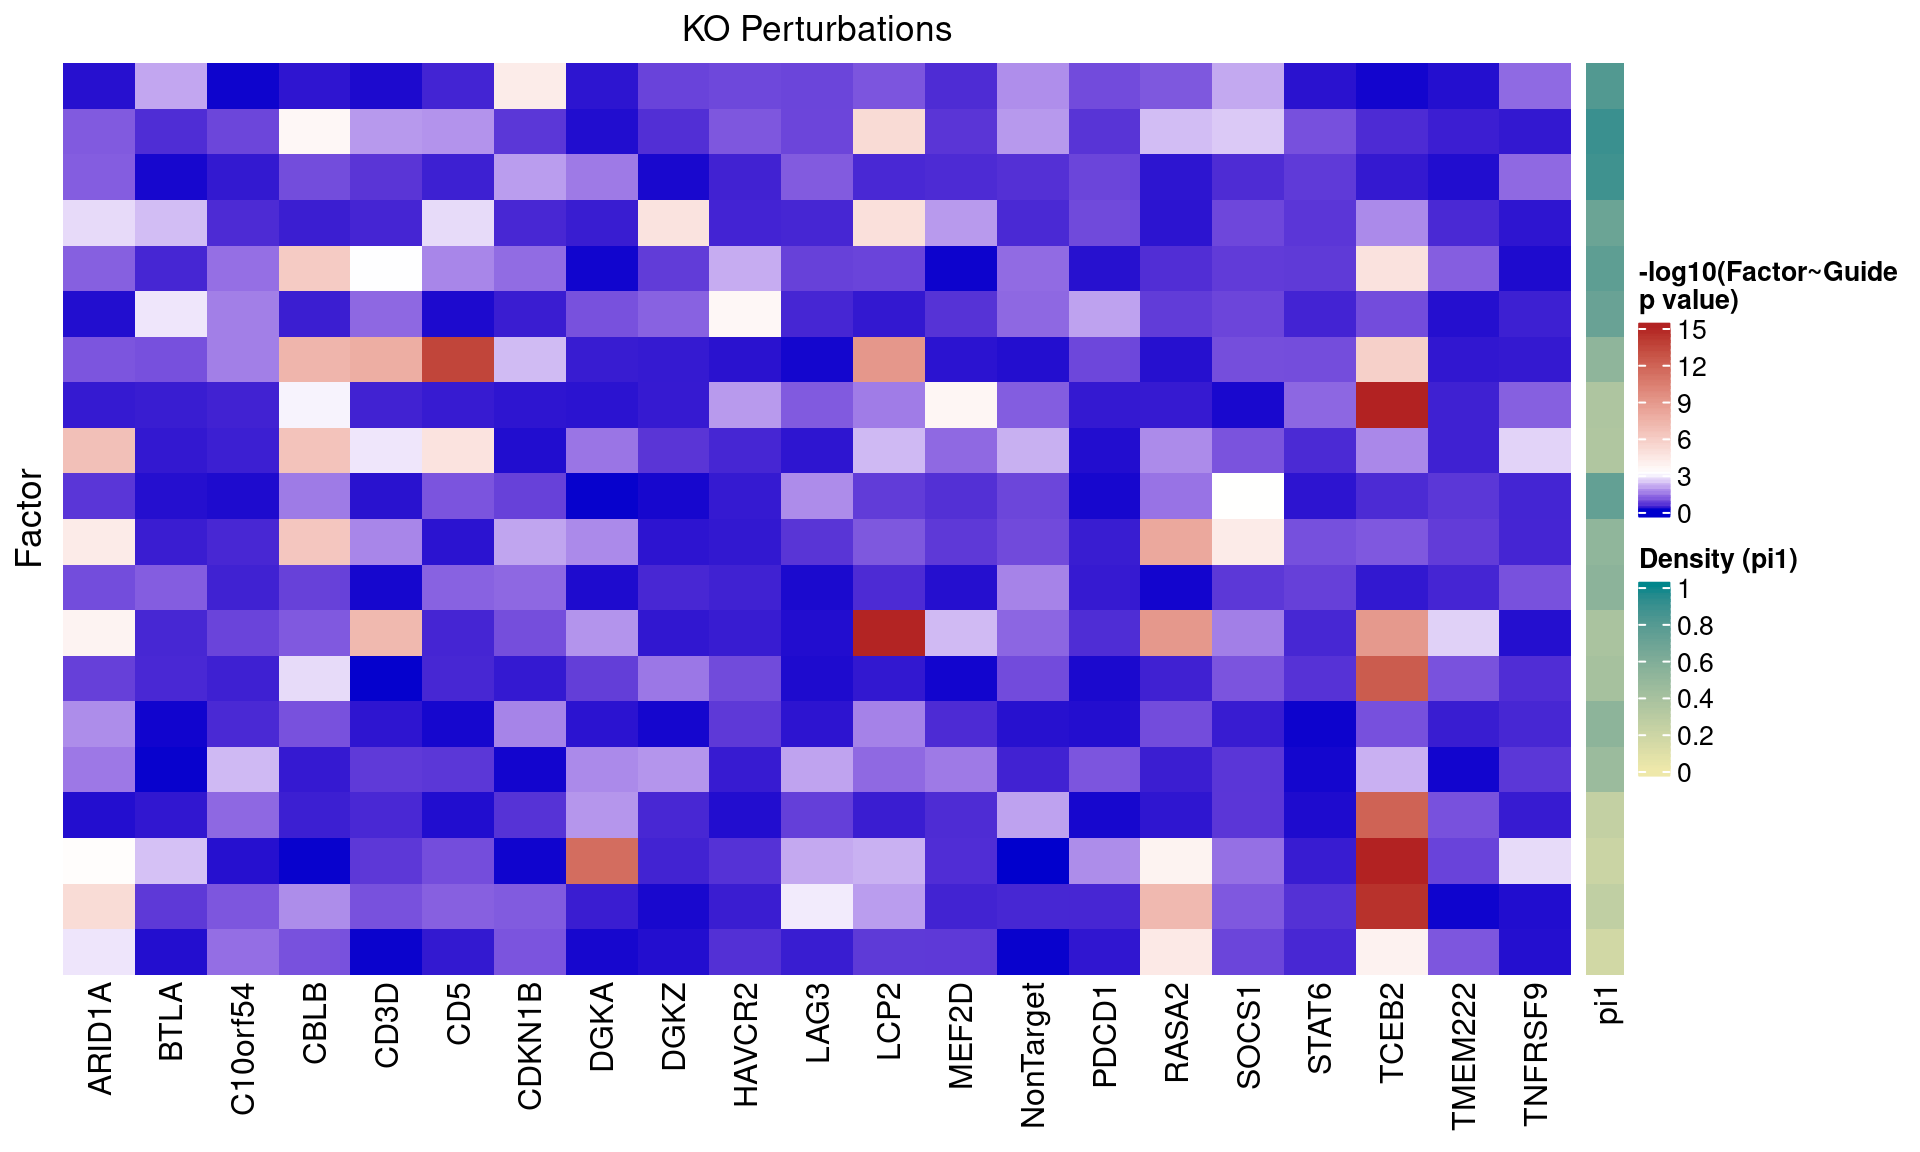
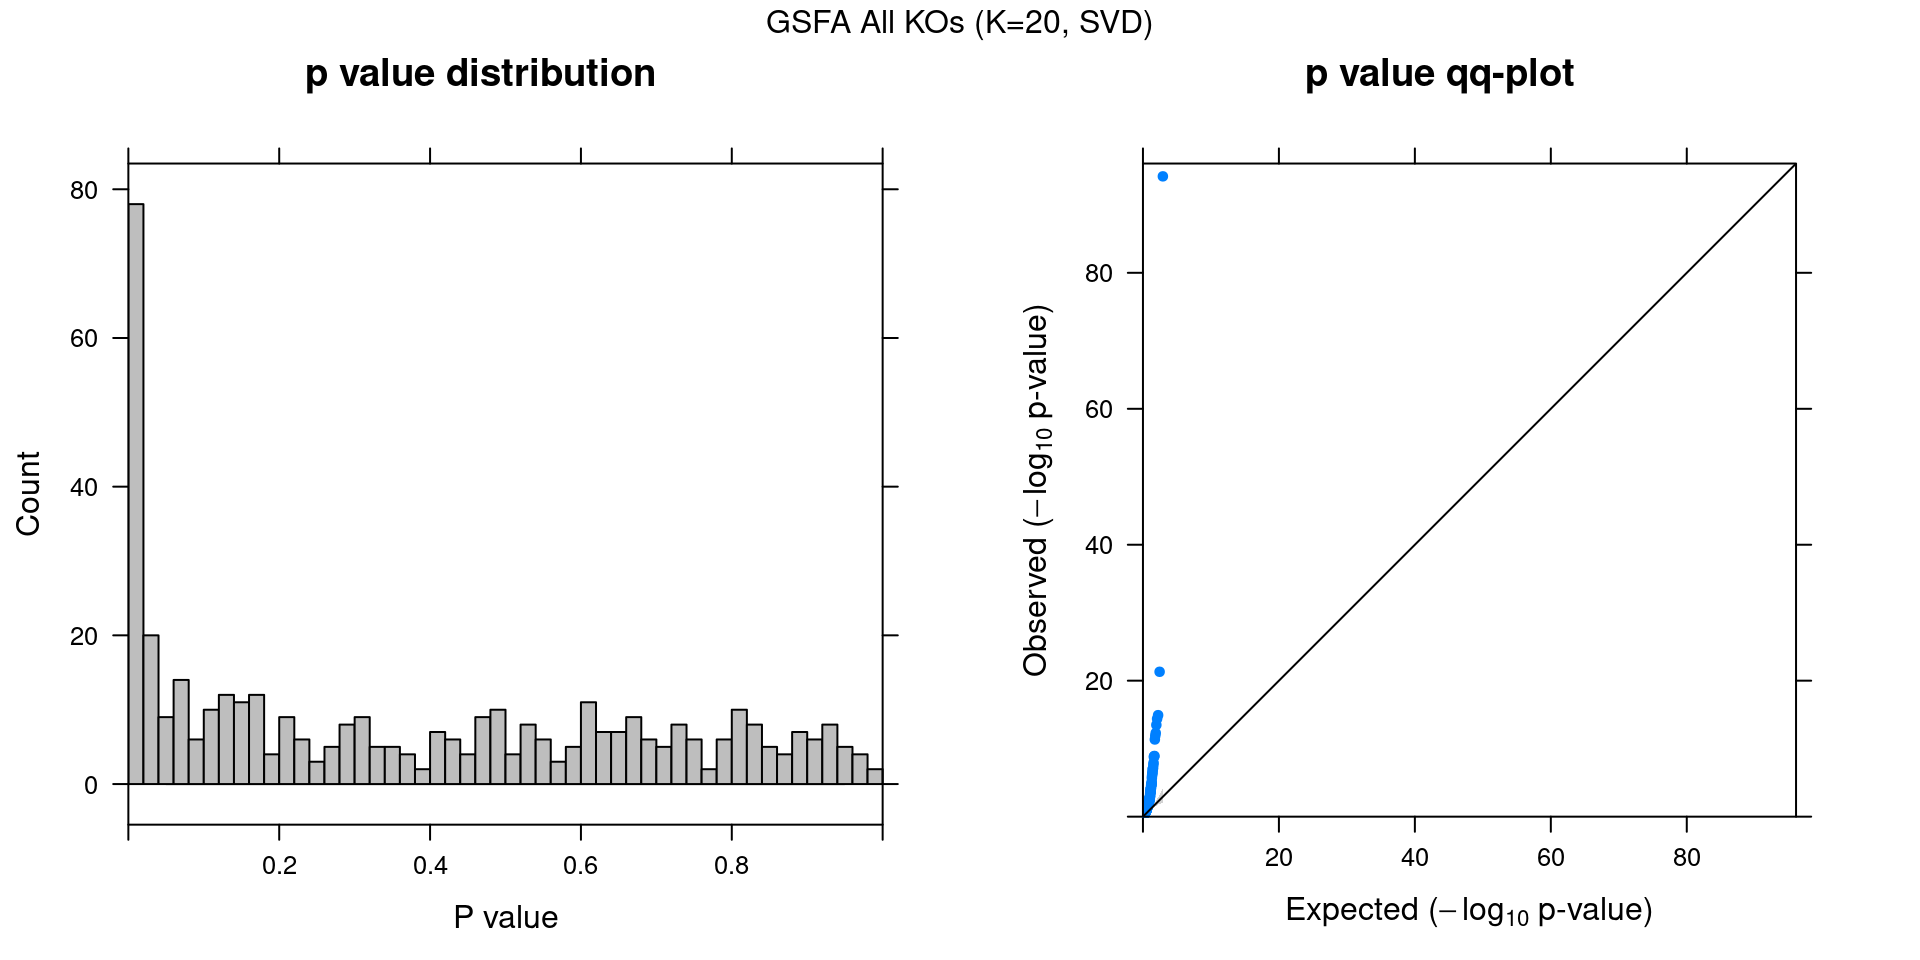
2.1.3 Factor ~ KO Posterior Association
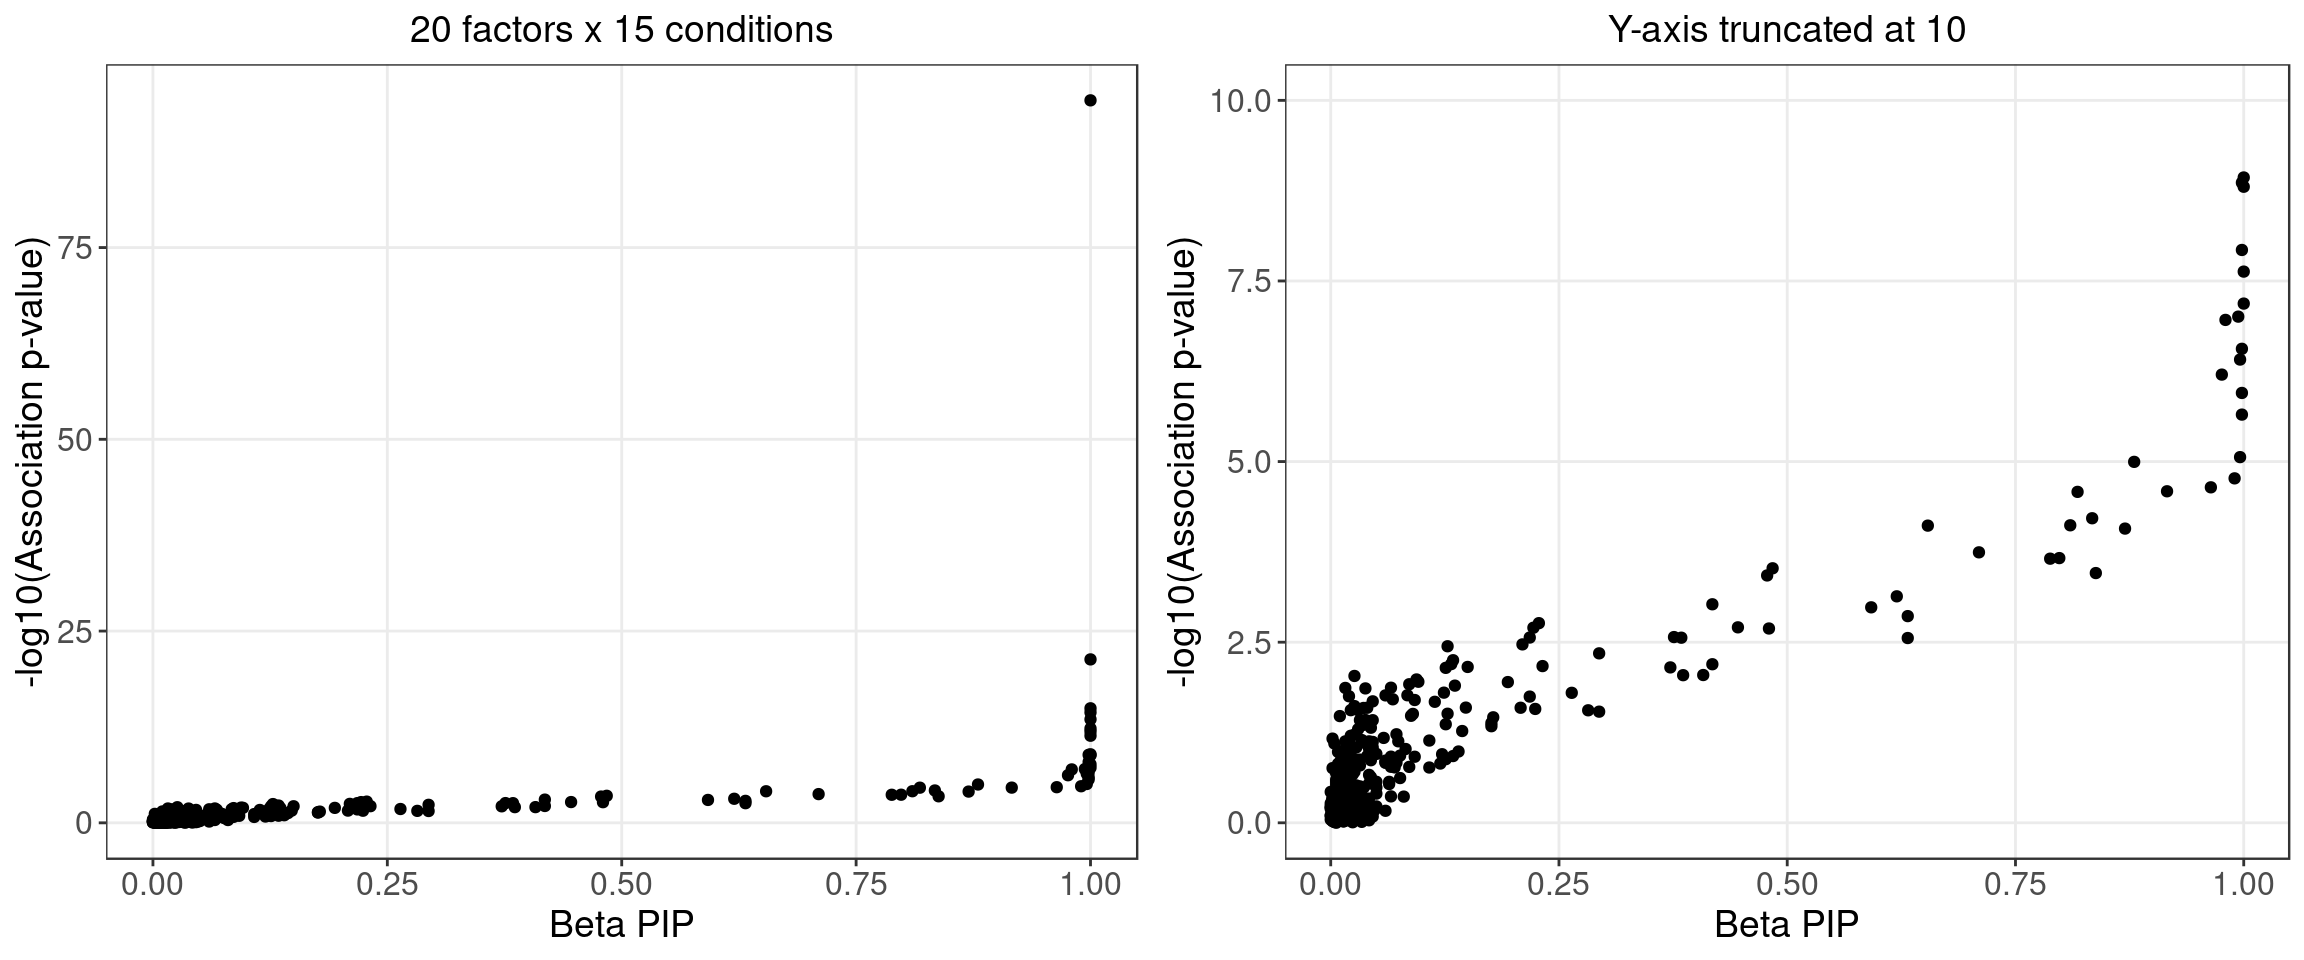
2.1.4 Beta PIP vs P-Value
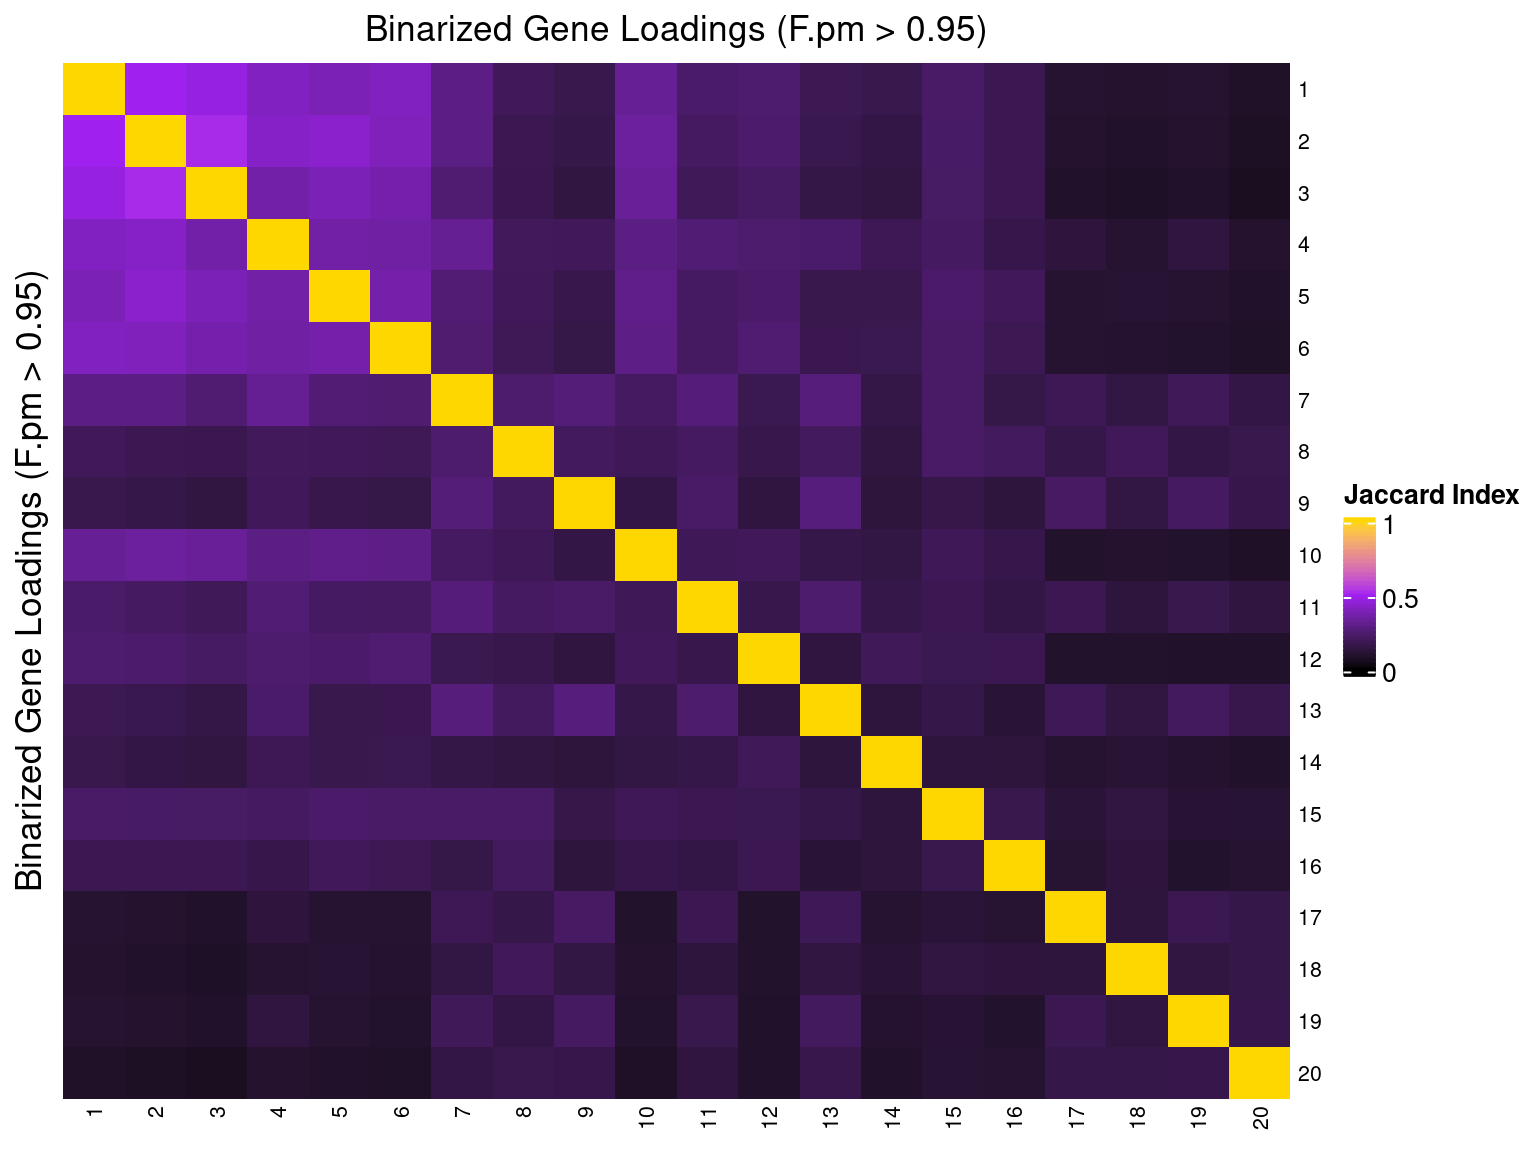
2.1.5 Correlation btw Factors
2.2 Alternative Initializations and Chain Convergence
Other than initializing GSFA using truncated SVD, we also ran 2 chains with random initialization.
2.2.1 Association results for 2 randomly initialized GSFA runs
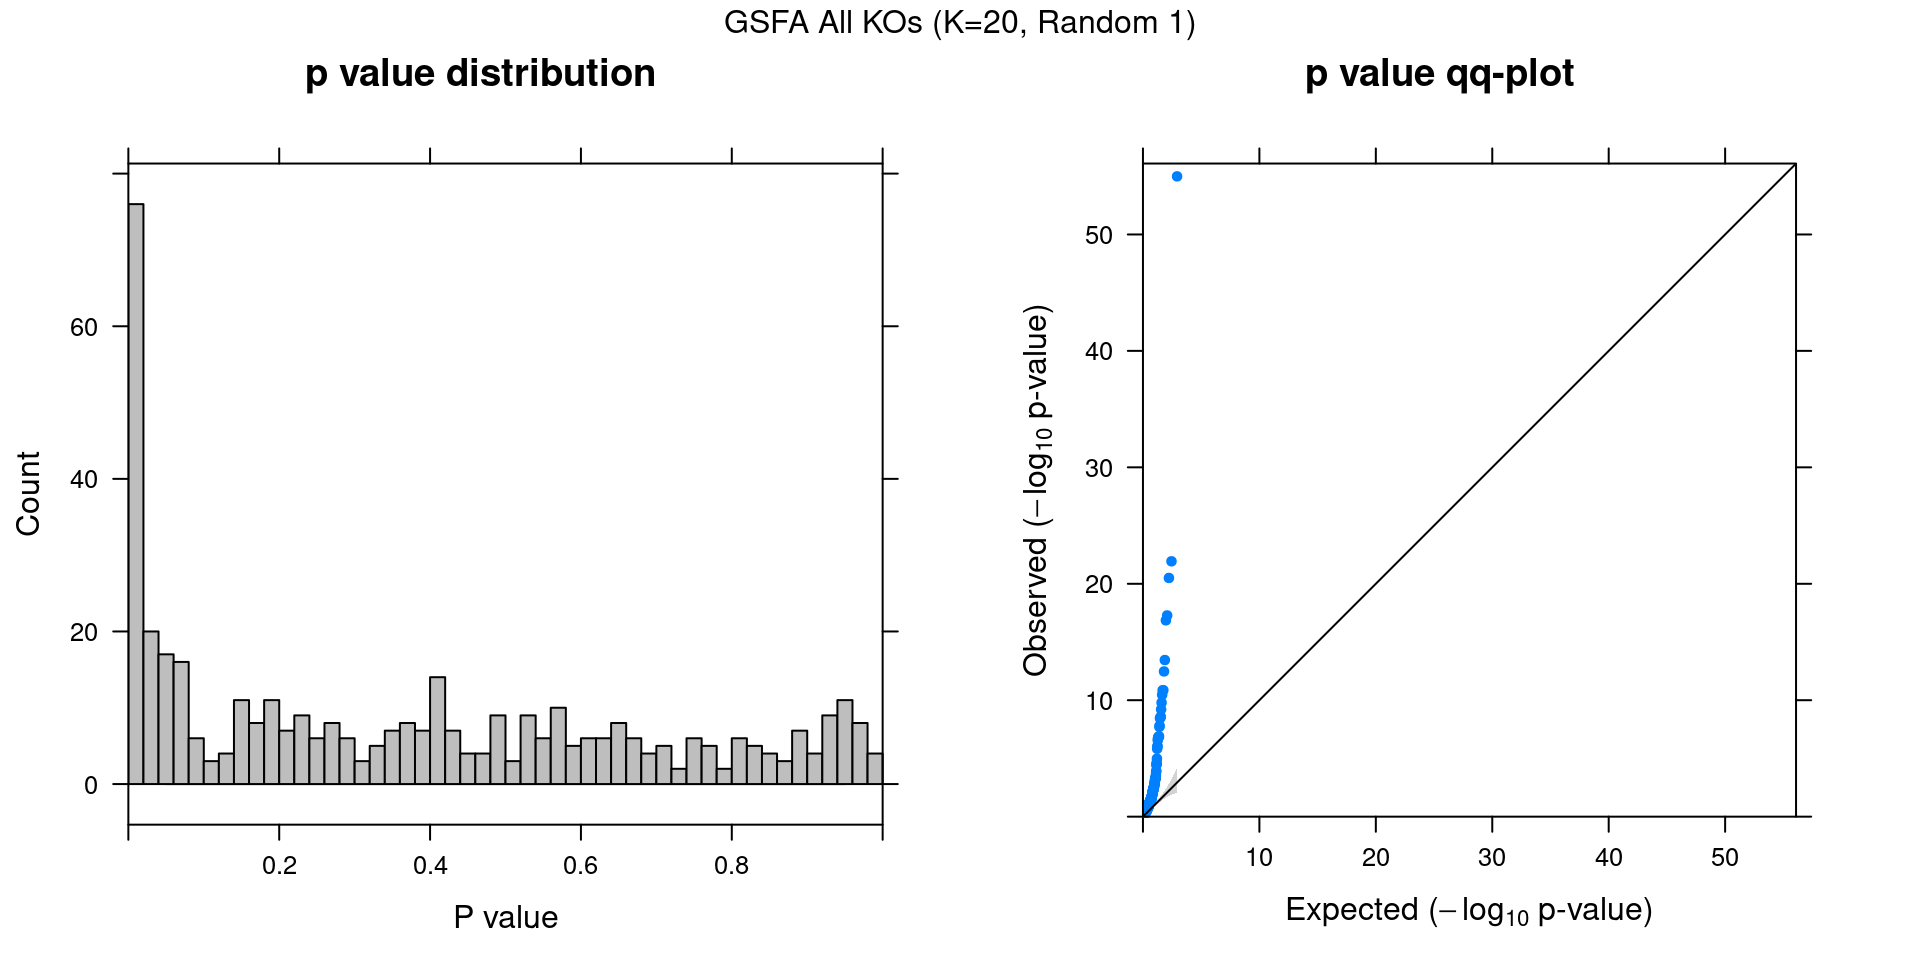
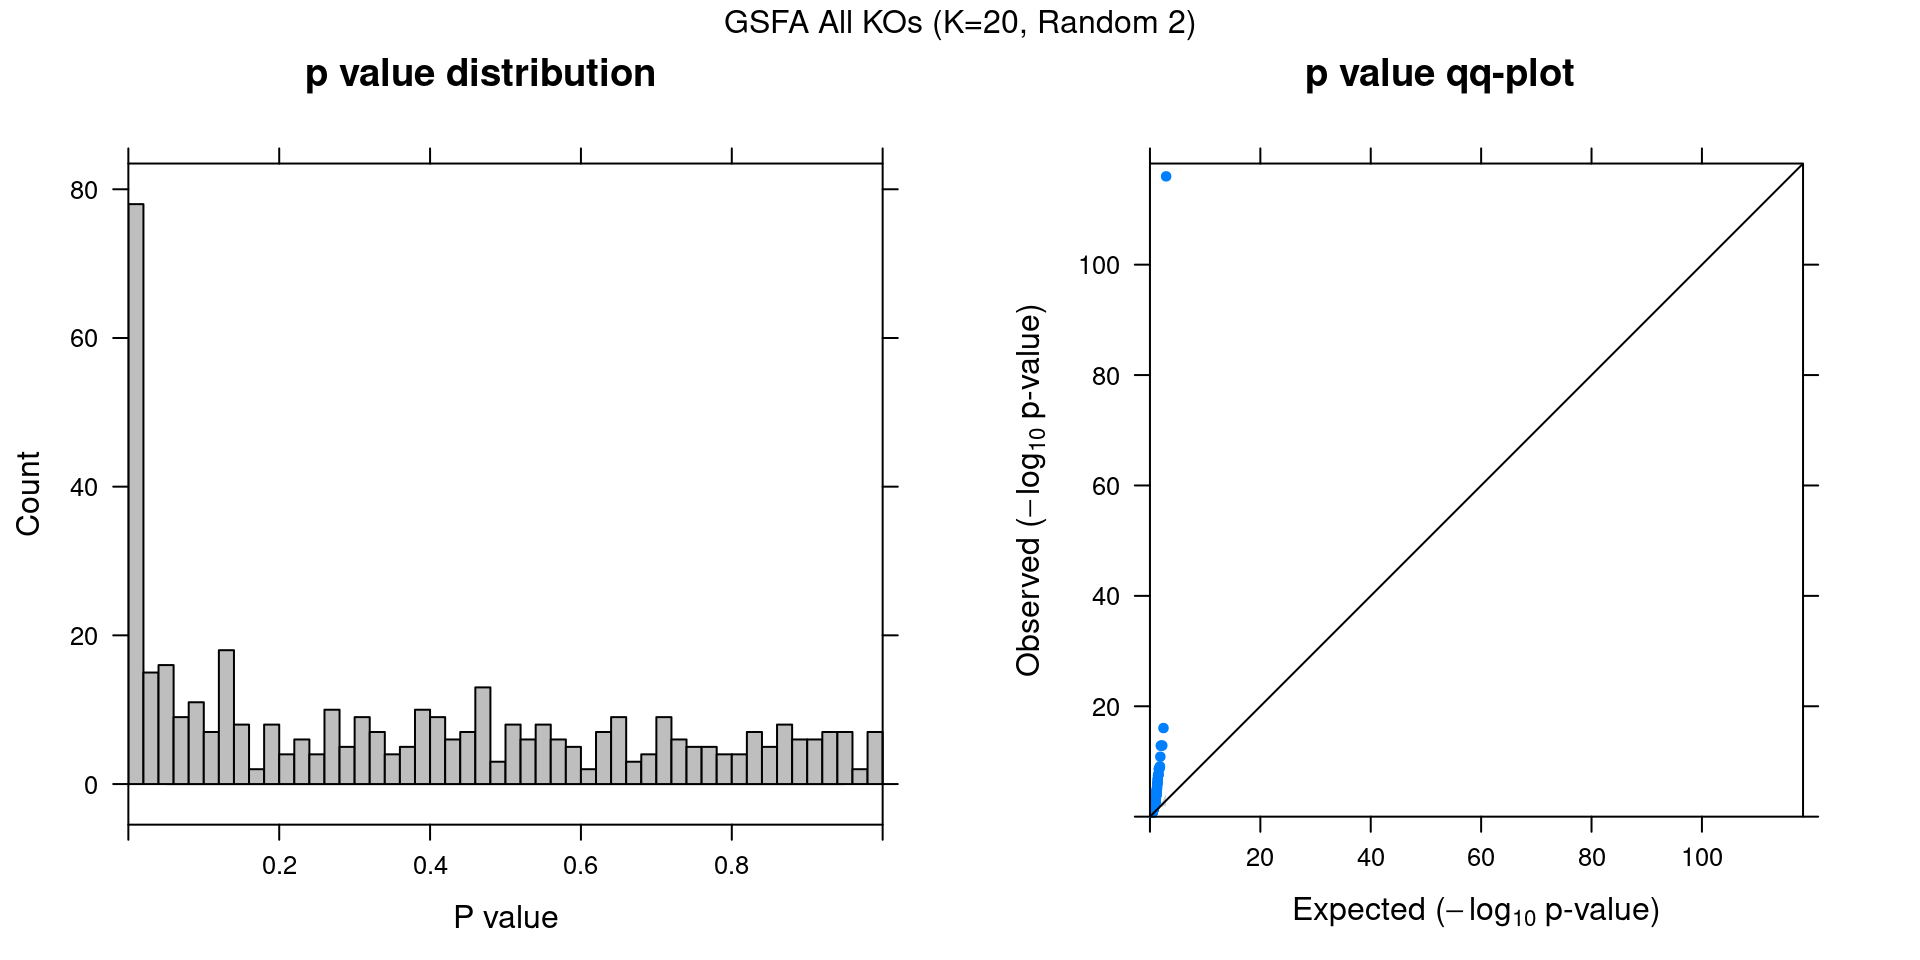
2.2.2 Chain mixing and convergence evaluation
| Min. | 1st Qu. | Median | Mean | 3rd Qu. | Max. | |
|---|---|---|---|---|---|---|
| ARID1A | 0.999 | 1.02 | 1.04 | 1.06 | 1.09 | 1.53 |
| BTLA | 0.999 | 1.02 | 1.07 | 1.10 | 1.19 | 1.32 |
| C10orf54 | 0.999 | 1.00 | 1.00 | 1.01 | 1.01 | 1.02 |
| CBLB | 1.000 | 1.04 | 1.09 | 1.11 | 1.15 | 1.70 |
| CD3D | 0.999 | 1.01 | 1.03 | 1.05 | 1.06 | 1.39 |
| CD5 | 0.999 | 1.03 | 1.09 | 1.13 | 1.20 | 1.75 |
| CDKN1B | 1.000 | 1.05 | 1.10 | 1.13 | 1.17 | 1.79 |
| DGKA | 0.999 | 1.00 | 1.02 | 1.08 | 1.10 | 1.88 |
| DGKZ | 0.999 | 1.05 | 1.12 | 1.18 | 1.22 | 1.96 |
| HAVCR2 | 1.000 | 1.03 | 1.09 | 1.13 | 1.18 | 1.88 |
| LAG3 | 0.999 | 1.00 | 1.00 | 1.01 | 1.01 | 1.13 |
| LCP2 | 0.999 | 1.04 | 1.08 | 1.10 | 1.13 | 1.54 |
| MEF2D | 0.999 | 1.00 | 1.01 | 1.03 | 1.04 | 1.23 |
| NonTarget | 0.999 | 1.01 | 1.02 | 1.03 | 1.05 | 1.10 |
| PDCD1 | 0.999 | 1.00 | 1.00 | 1.00 | 1.00 | 1.01 |
| RASA2 | 1.000 | 1.03 | 1.06 | 1.07 | 1.10 | 1.48 |
| SOCS1 | 1.000 | 1.05 | 1.09 | 1.12 | 1.16 | 1.88 |
| STAT6 | 0.999 | 1.00 | 1.00 | 1.00 | 1.00 | 1.01 |
| TCEB2 | 0.999 | 1.03 | 1.08 | 1.12 | 1.16 | 2.04 |
| TMEM222 | 0.999 | 1.00 | 1.00 | 1.00 | 1.00 | 1.02 |
| TNFRSF9 | 0.999 | 1.00 | 1.00 | 1.01 | 1.01 | 1.08 |
| offset | 0.999 | 1.00 | 1.00 | 1.00 | 1.01 | 1.03 |
2.2.3 Difference btw methods in factor estimation
For a pair of \(Z\) estimations from 2 inference methods, \(Z_1, Z_2\), we quantify the pairwise estimation difference as \(||Z_1Z_1^T - Z_2Z_2^T||_F/N\), where \(||\cdot||\) is the Frobenius norm of a matrix, and \(N\) is the number of rows (samples) in \(Z\).
Guided SVD vs Rand_01: 0.57
Guided SVD vs Rand_02: 0.438
Rand_01 vs Rand_02: 0.516
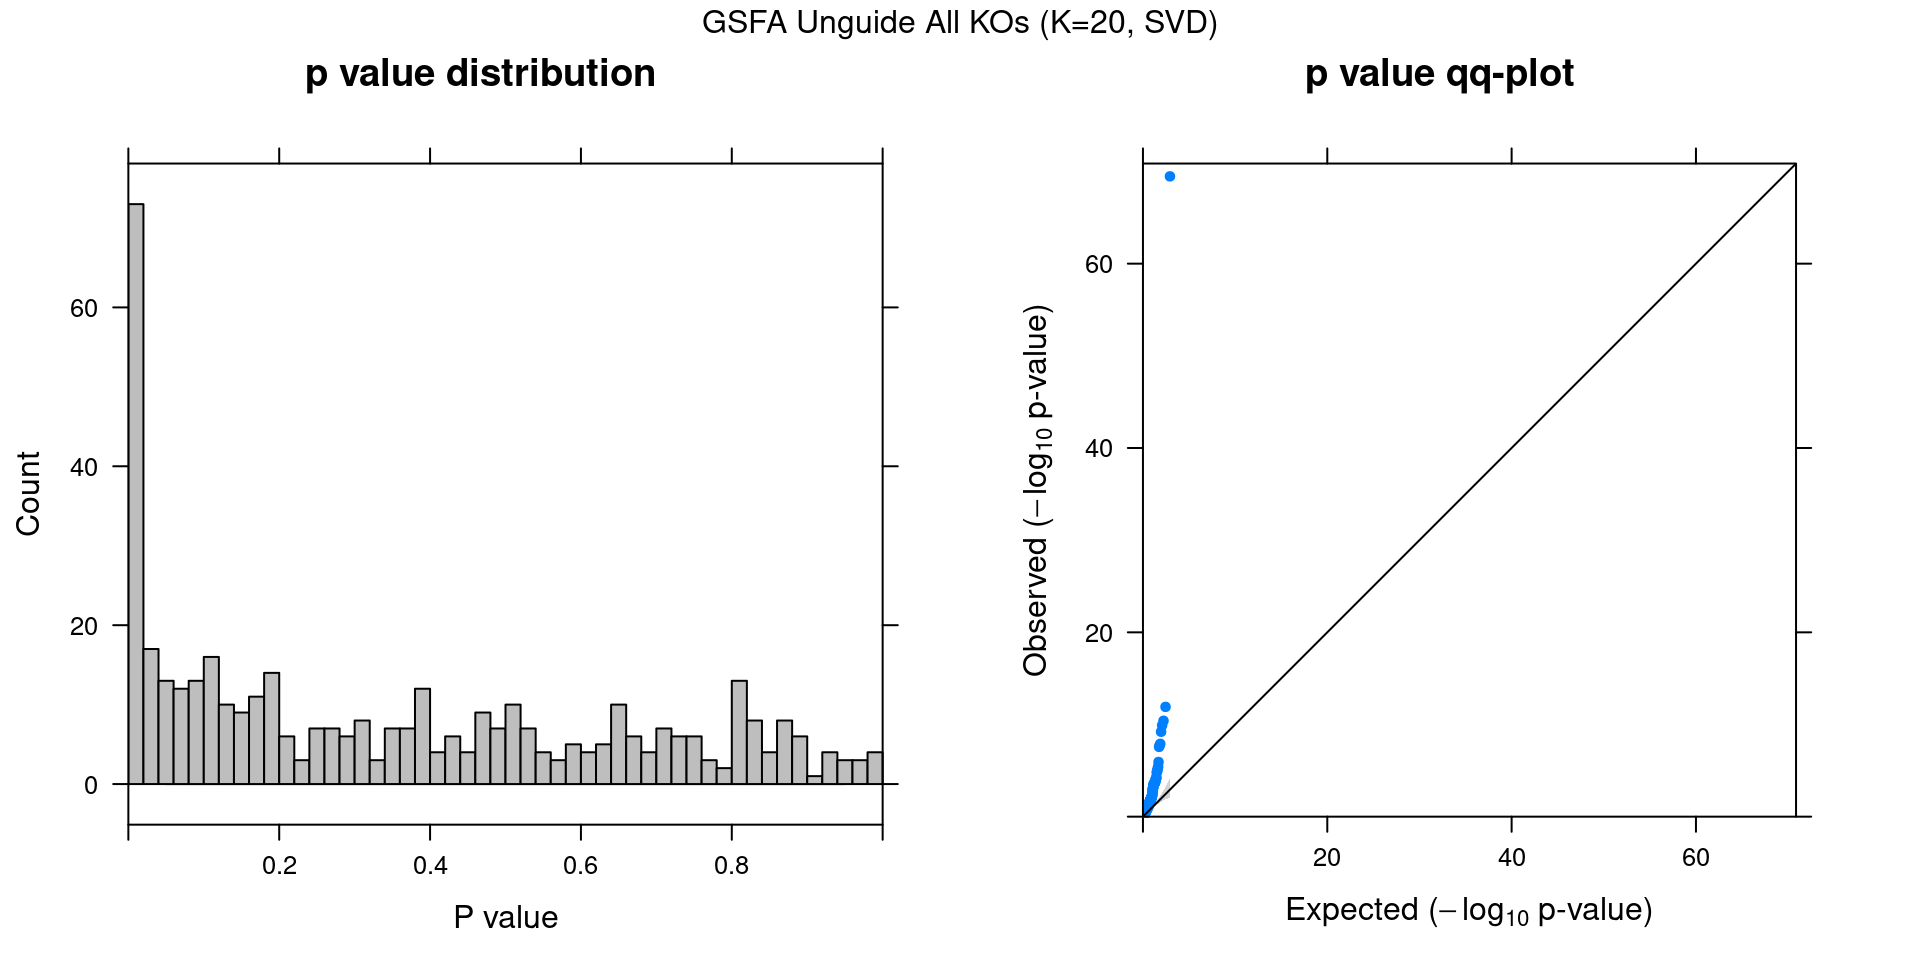
3 Unguided Result
In contrast to the guided version, here we provide no guidance (\(G = \vec{0}\)) to our sparse factor analysis model to serve as a comparison.
3.1 Factor ~ KO Posterior Association
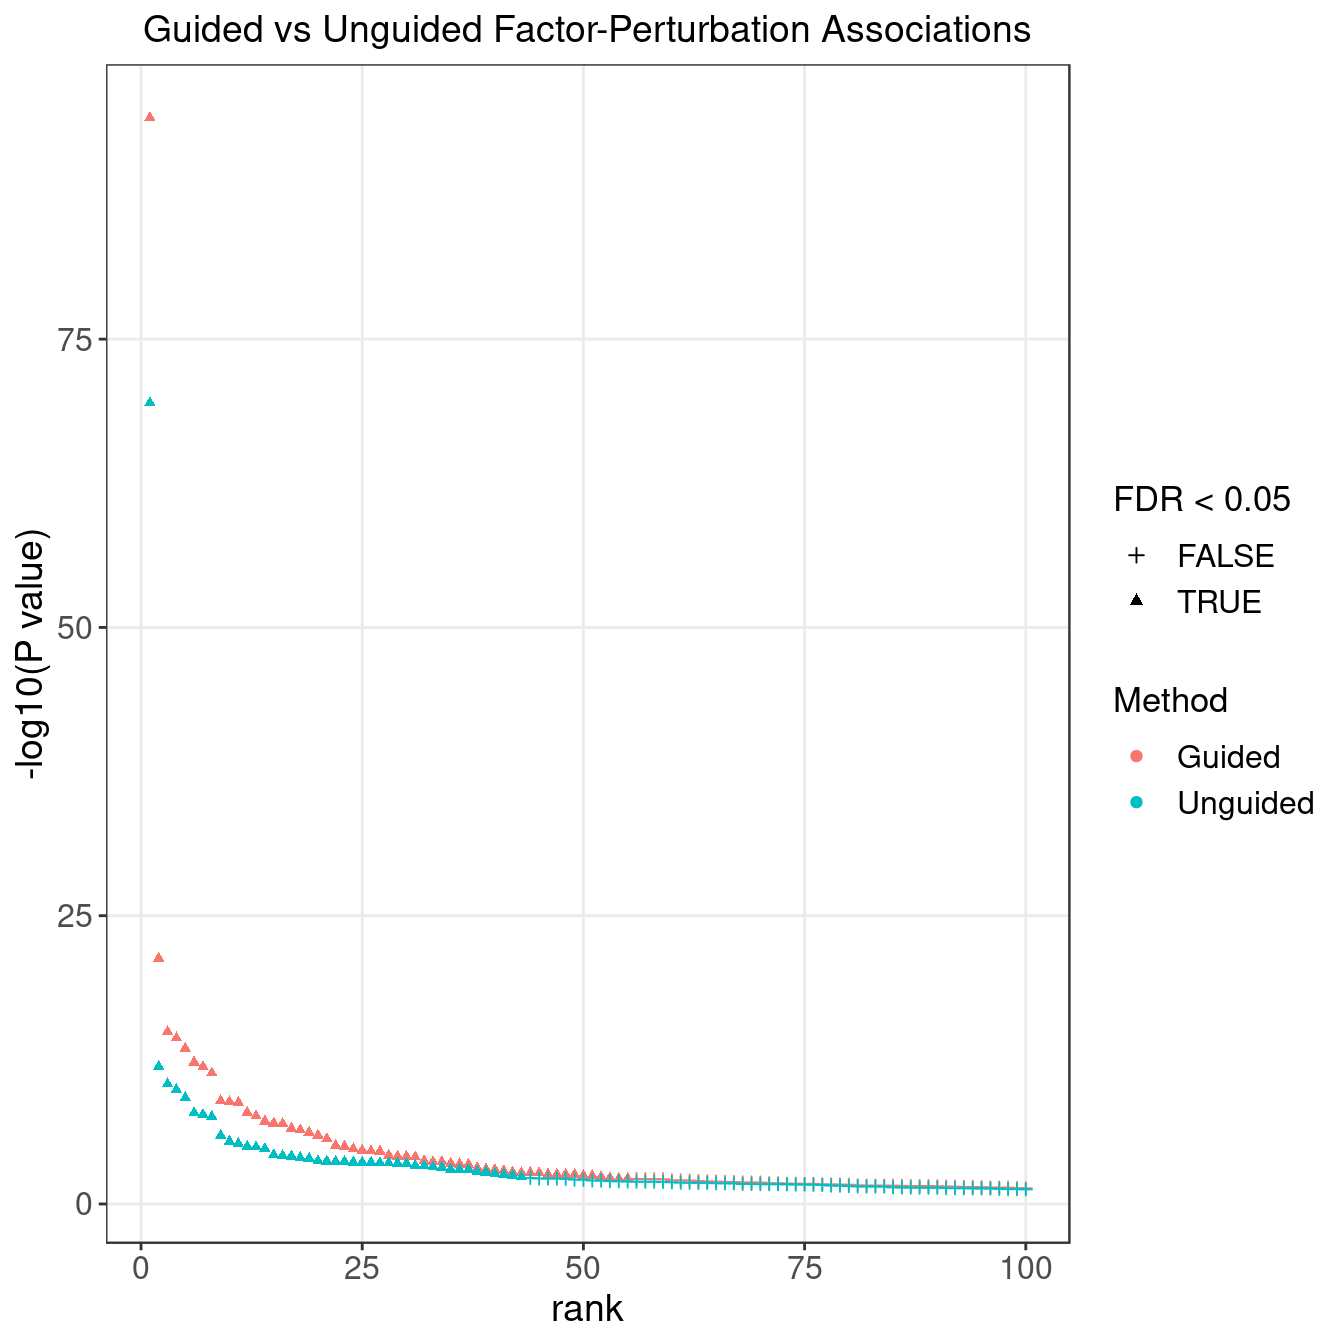
3.2 Unguided vs Guided
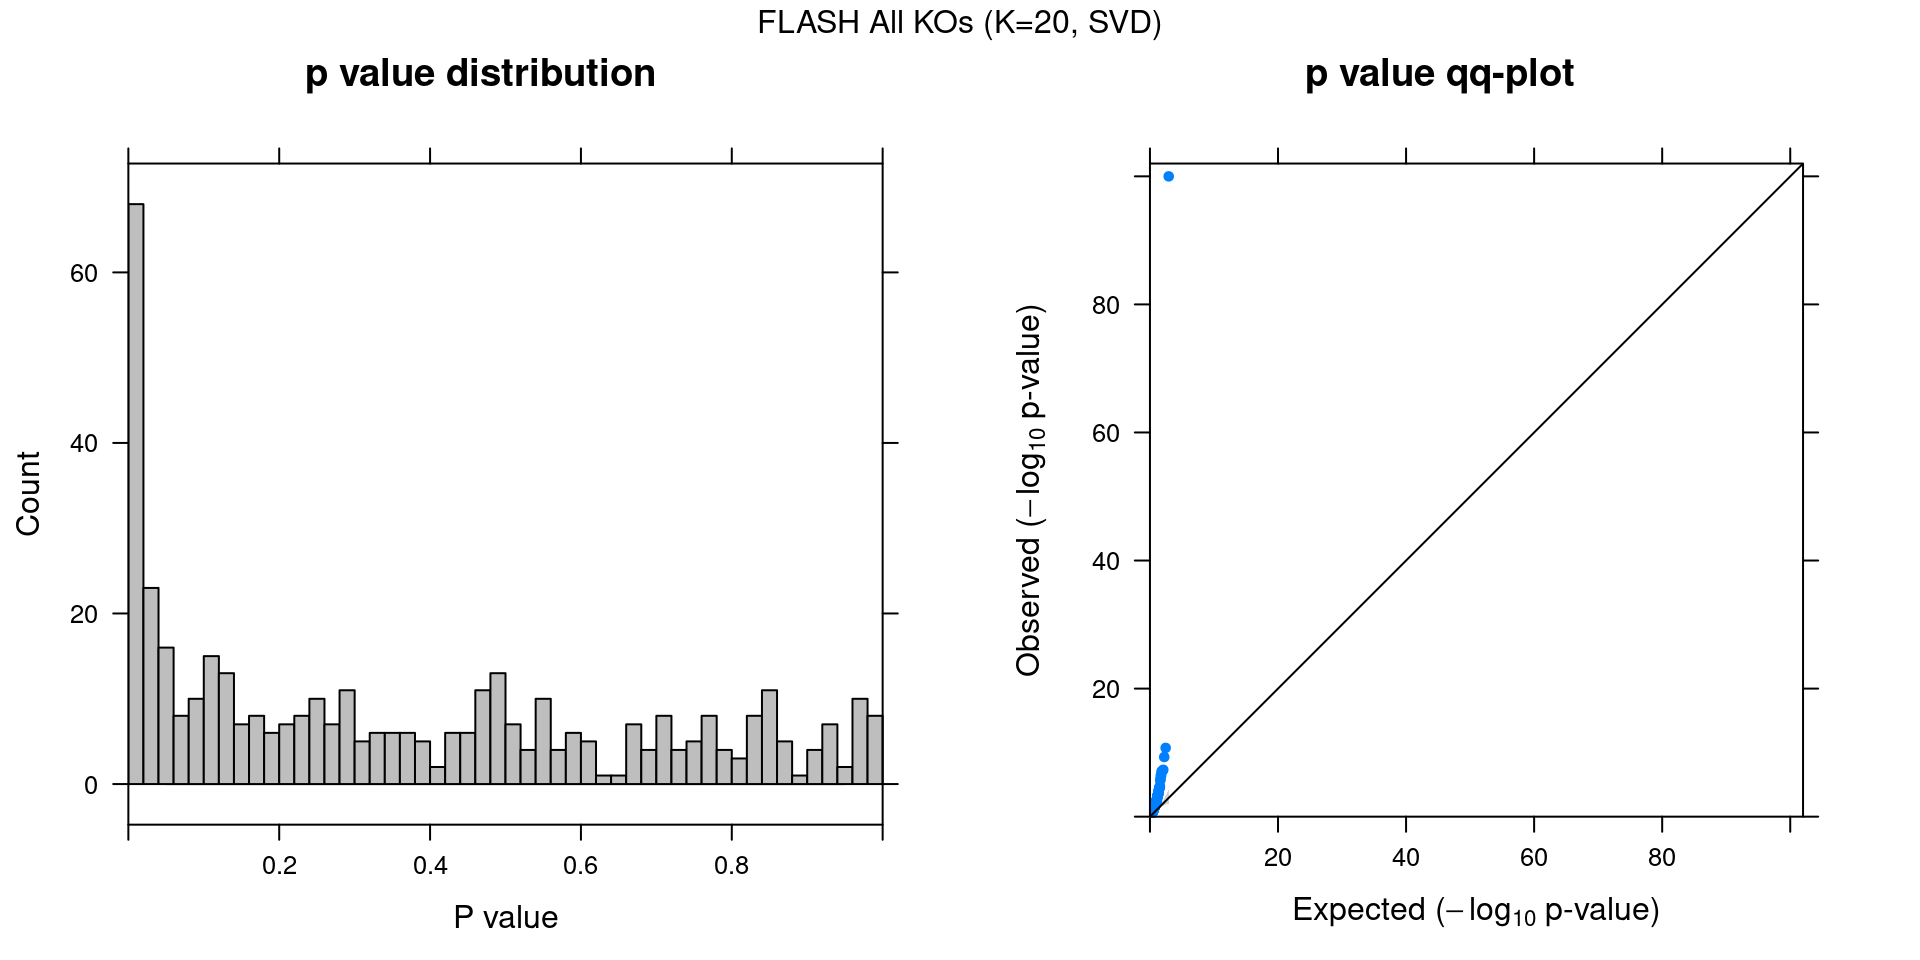
4 FLASH
4.1 Factor ~ KO Posterior Association
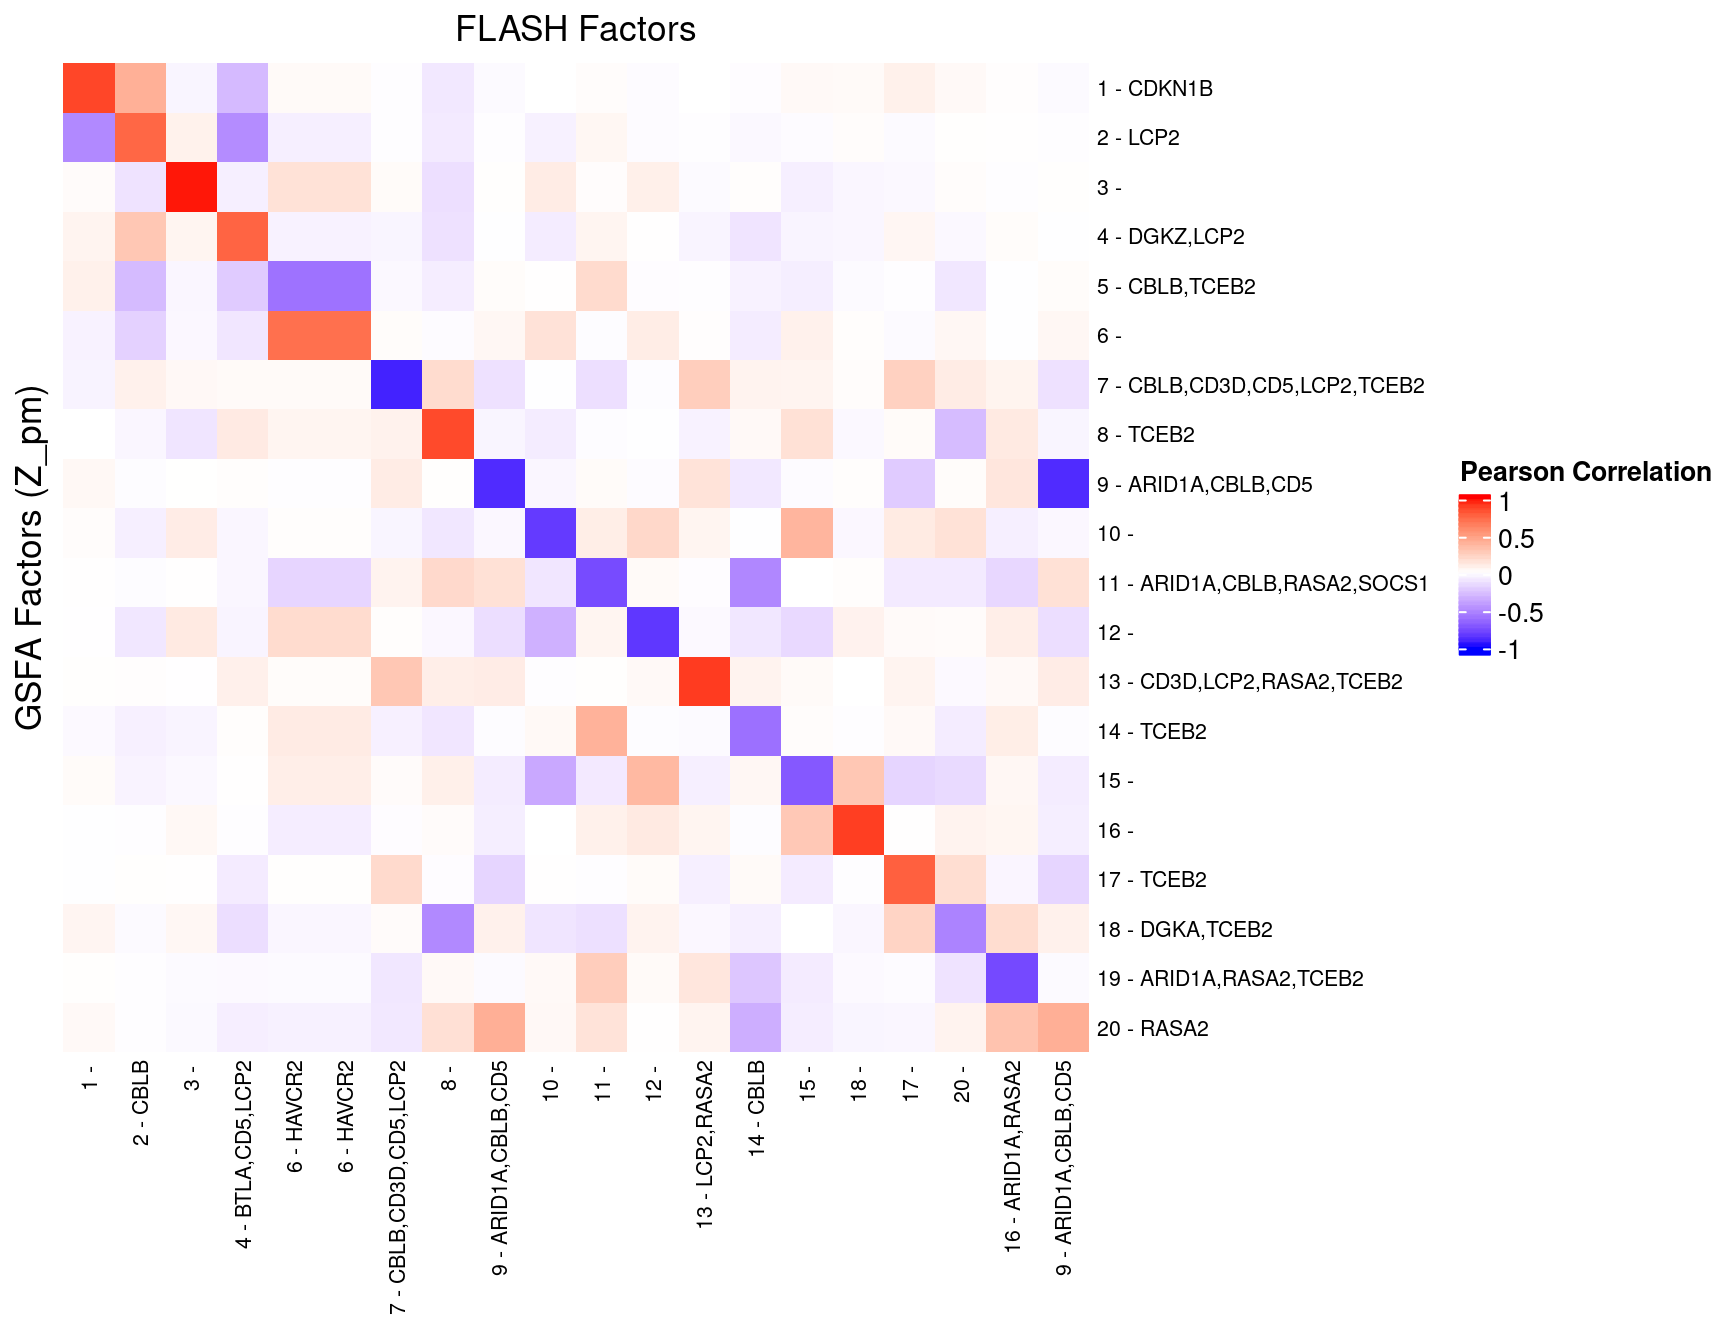
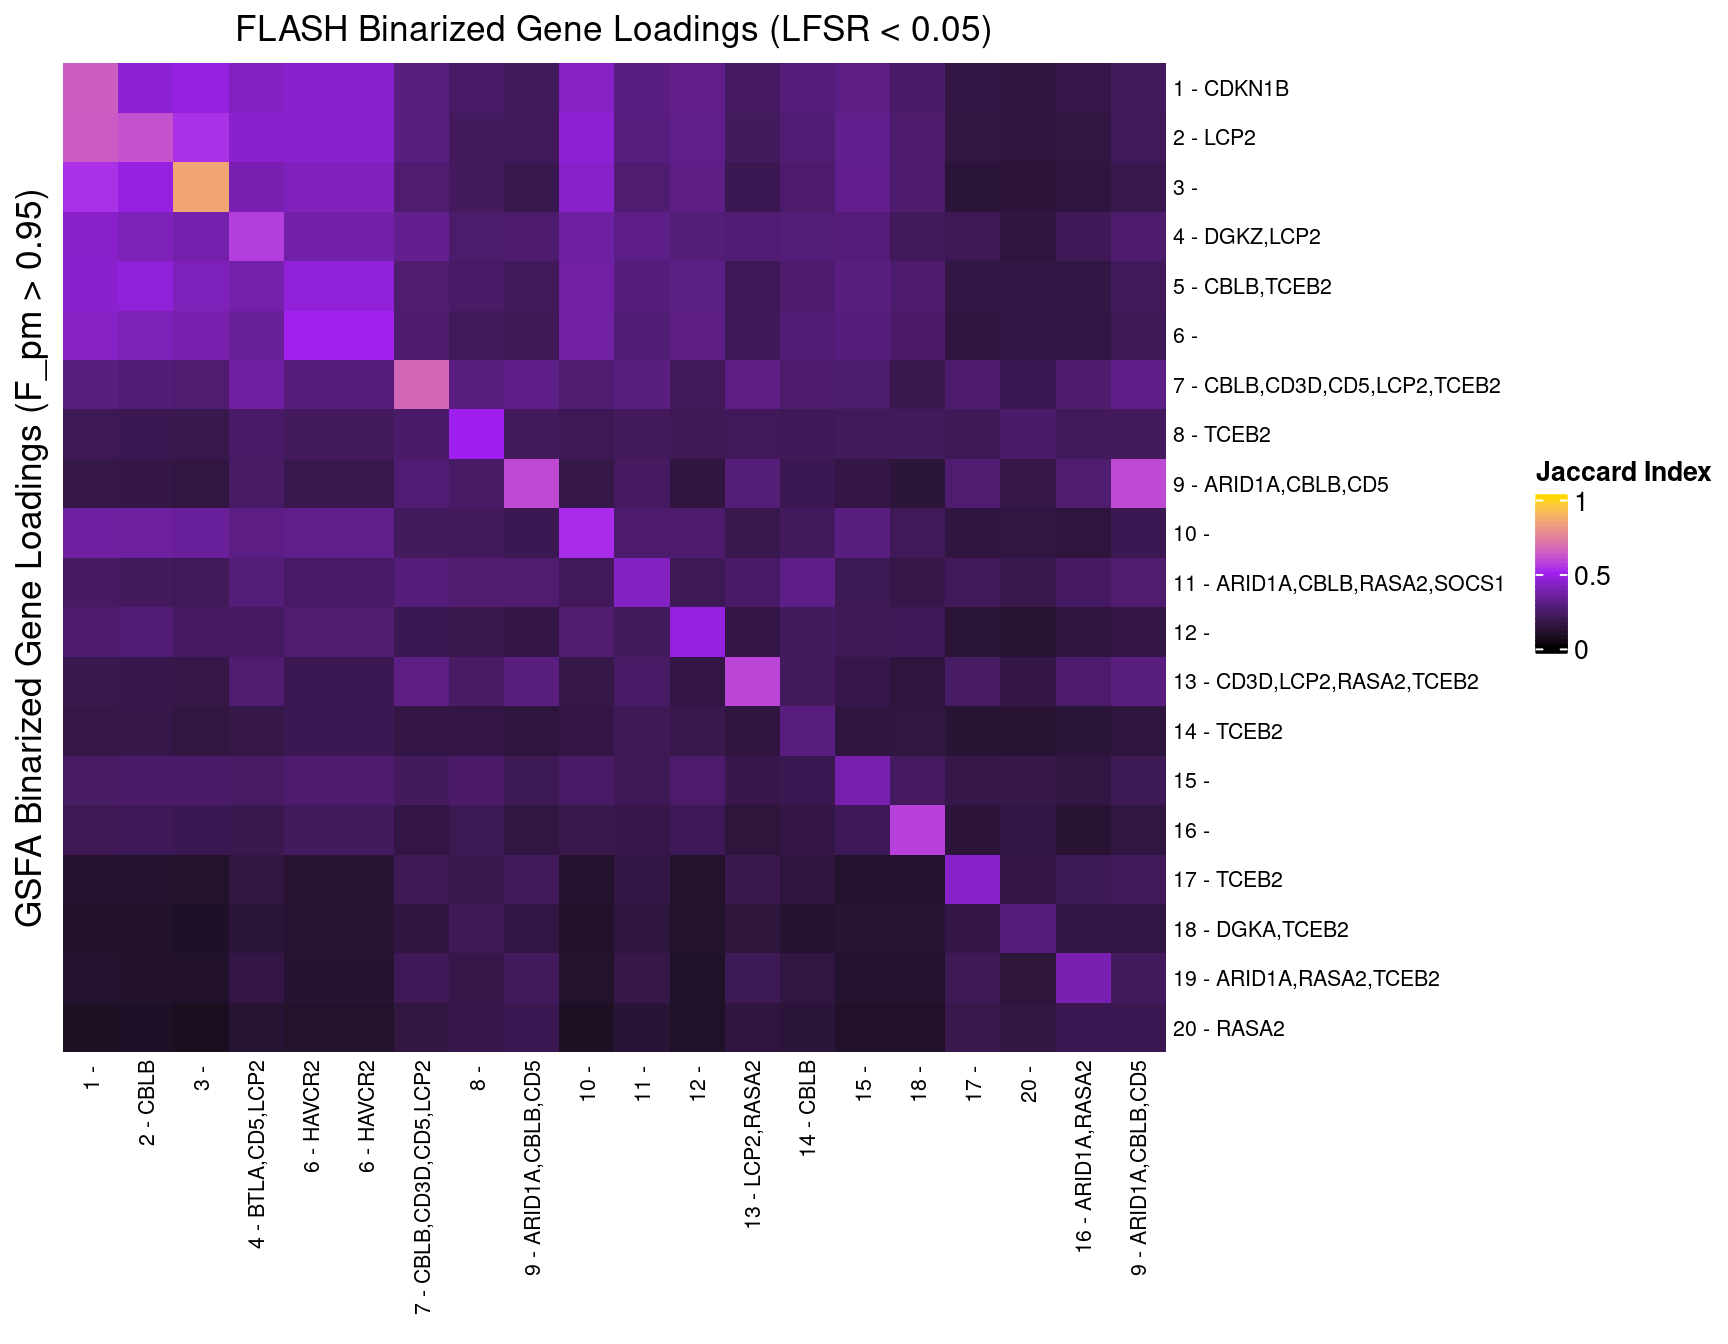
4.2 FLASH vs GSFA
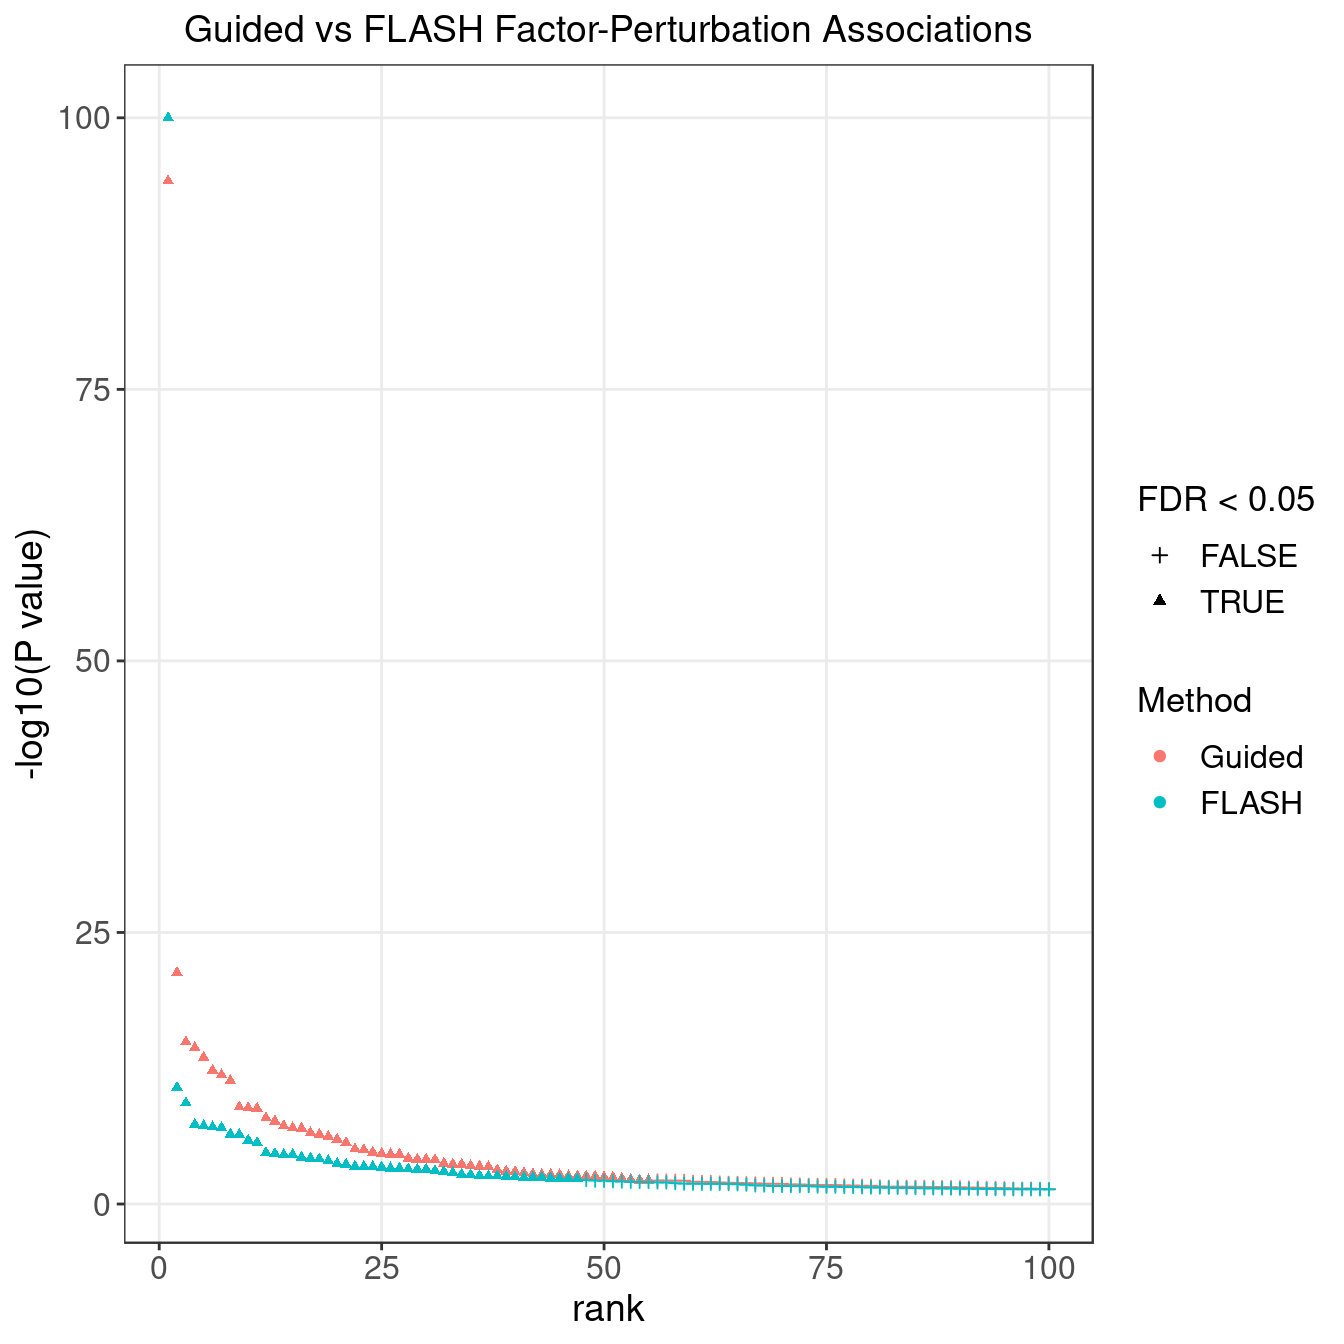
We matched the factors obtained from GFSA with those from FLASH, and conducted pairwise comparisons for both factors and gene loadings.
In the following heatmaps, factors are labeled by the KO condition(s) that they have an association p-value < 1e-4 with.
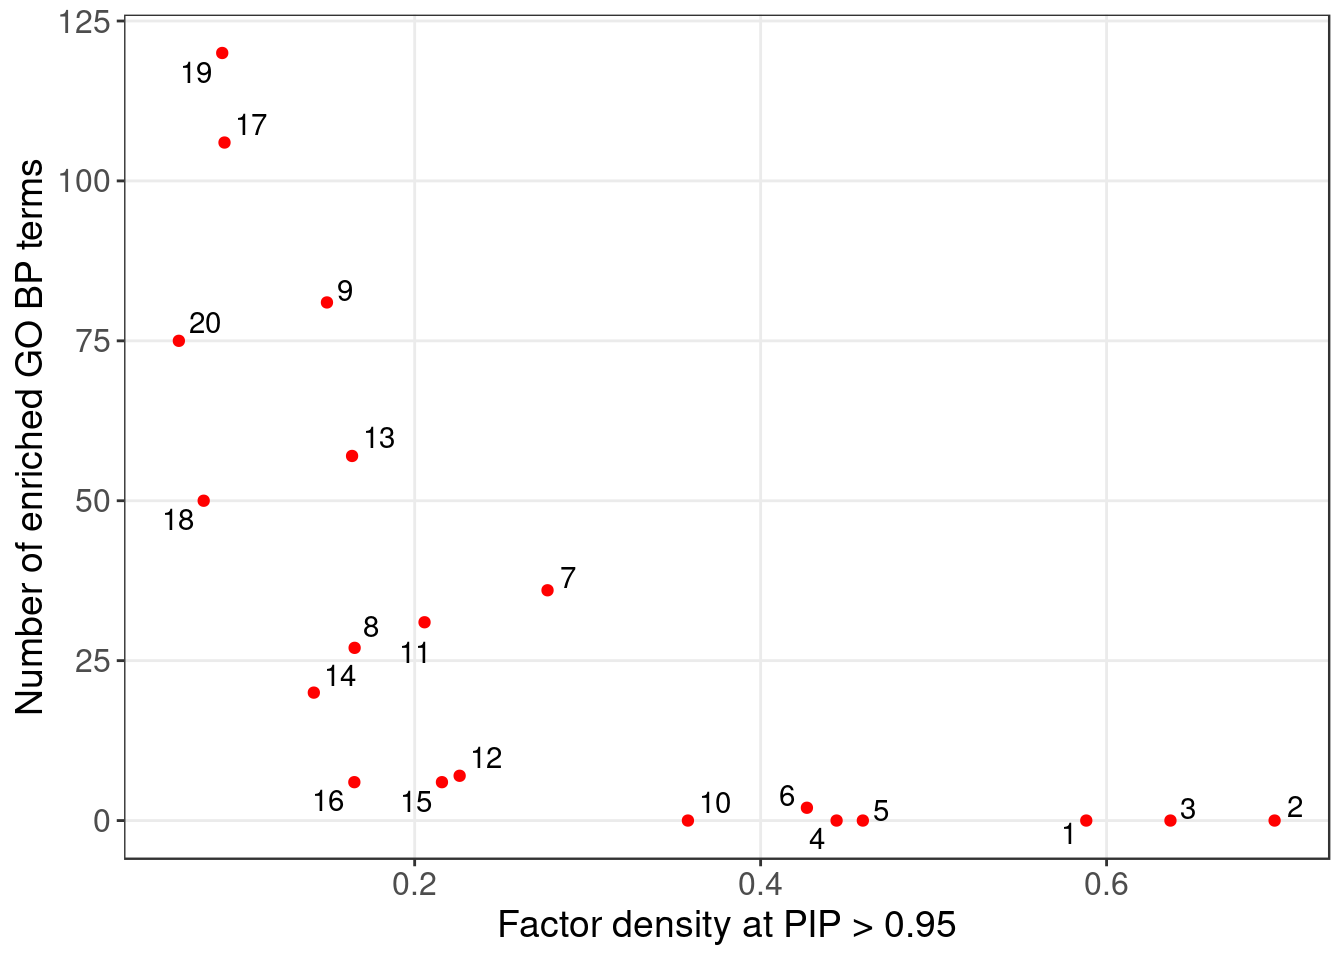
5 Gene Ontology Enrichment Analysis
Target genes: Genes w/ non-zero loadings in each factor (PIP cutoff at 0.95);
Backgroud genes: all 6062 genes used in factor analysis;
Statistical test: hypergeometric test (over-representation test);
Only GO terms/pathways that satisfy fold change \(\geq\) 2 and test FDR \(<\) 0.05 are shown below.
5.1 GO Slim Over-Representation Analysis
Gene sets: Gene ontology “Biological Process” (non-redundant).
| GeneSet | description | enrichmentRatio | pValue | FDR | GeneRatio |
|---|---|---|---|---|---|
| GO:0061641 | CENP-A containing chromatin organization | 2.065193 | 0.0000009 | 0.0000956 | 24/27 |
| GO:0022616 | DNA strand elongation | 2.013563 | 0.0006495 | 0.0206995 | 13/15 |
| GeneSet | description | enrichmentRatio | pValue | FDR | GeneRatio |
|---|---|---|---|---|---|
| GO:0034113 | heterotypic cell-cell adhesion | 3.372890 | 0.0000001 | 0.0000034 | 15/16 |
| GO:0042092 | type 2 immune response | 3.237975 | 0.0000730 | 0.0011150 | 9/10 |
| GO:0032633 | interleukin-4 production | 2.878200 | 0.0000388 | 0.0006607 | 12/15 |
| GO:0002437 | inflammatory response to antigenic stimulus | 2.698312 | 0.0001157 | 0.0015423 | 12/16 |
| GO:1990868 | response to chemokine | 2.698312 | 0.0001157 | 0.0015423 | 12/16 |
| GO:0044091 | membrane biogenesis | 2.698312 | 0.0009088 | 0.0076571 | 9/12 |
| GO:0001773 | myeloid dendritic cell activation | 2.638350 | 0.0003170 | 0.0035749 | 11/15 |
| GO:0007200 | phospholipase C-activating G protein-coupled receptor signaling pathway | 2.518425 | 0.0066501 | 0.0314483 | 7/10 |
| GO:0032941 | secretion by tissue | 2.518425 | 0.0066501 | 0.0314483 | 7/10 |
| GO:1901522 | positive regulation of transcription from RNA polymerase II promoter involved in cellular response to chemical stimulus | 2.518425 | 0.0066501 | 0.0314483 | 7/10 |
| GO:0032963 | collagen metabolic process | 2.461618 | 0.0002628 | 0.0031073 | 13/19 |
| GO:0031579 | membrane raft organization | 2.398500 | 0.0056617 | 0.0286209 | 8/12 |
| GO:0032528 | microvillus organization | 2.398500 | 0.0056617 | 0.0286209 | 8/12 |
| GO:0045730 | respiratory burst | 2.398500 | 0.0056617 | 0.0286209 | 8/12 |
| GO:0033627 | cell adhesion mediated by integrin | 2.338537 | 0.0005605 | 0.0054055 | 13/20 |
| GO:0006949 | syncytium formation | 2.327956 | 0.0016140 | 0.0114859 | 11/17 |
| GO:1904019 | epithelial cell apoptotic process | 2.265250 | 0.0001385 | 0.0017597 | 17/27 |
| GO:0140253 | cell-cell fusion | 2.248594 | 0.0038449 | 0.0220183 | 10/16 |
| GO:0006959 | humoral immune response | 2.222139 | 0.0000341 | 0.0006253 | 21/34 |
| GO:0033028 | myeloid cell apoptotic process | 2.214000 | 0.0111596 | 0.0454443 | 8/13 |
| GO:0032602 | chemokine production | 2.198625 | 0.0031143 | 0.0190234 | 11/18 |
| GO:0032635 | interleukin-6 production | 2.139203 | 0.0000513 | 0.0008354 | 22/37 |
| GO:0032609 | interferon-gamma production | 2.116323 | 0.0001392 | 0.0017597 | 20/34 |
| GO:0007229 | integrin-mediated signaling pathway | 2.089016 | 0.0003768 | 0.0040647 | 18/31 |
| GO:0032612 | interleukin-1 production | 2.075625 | 0.0012768 | 0.0095548 | 15/26 |
| GO:0050663 | cytokine secretion | 2.064283 | 0.0000010 | 0.0000381 | 35/61 |
| GO:0001906 | cell killing | 2.055857 | 0.0000034 | 0.0001043 | 32/56 |
| GO:0034109 | homotypic cell-cell adhesion | 2.055857 | 0.0010152 | 0.0080889 | 16/28 |
| GO:0042116 | macrophage activation | 2.055857 | 0.0043826 | 0.0241536 | 12/21 |
| GO:0042476 | odontogenesis | 2.055857 | 0.0043826 | 0.0241536 | 12/21 |
| GO:0007187 | G protein-coupled receptor signaling pathway, coupled to cyclic nucleotide second messenger | 2.038725 | 0.0008062 | 0.0071195 | 17/30 |
| GO:0043062 | extracellular structure organization | 2.036462 | 0.0000090 | 0.0002271 | 30/53 |
| GO:0002065 | columnar/cuboidal epithelial cell differentiation | 2.014740 | 0.0027204 | 0.0170430 | 14/25 |
| GO:1902579 | multi-organism localization | 2.014740 | 0.0027204 | 0.0170430 | 14/25 |
| GO:0007162 | negative regulation of cell adhesion | 2.013027 | 0.0000000 | 0.0000031 | 47/84 |
| GO:0060326 | cell chemotaxis | 2.004460 | 0.0000007 | 0.0000290 | 39/70 |
| GeneSet | description | enrichmentRatio | pValue | FDR | GeneRatio |
|---|---|---|---|---|---|
| GO:0070972 | protein localization to endoplasmic reticulum | 4.372239 | 0.0000000 | 0.0000000 | 91/121 |
| GO:0045730 | respiratory burst | 3.875758 | 0.0001917 | 0.0048455 | 8/12 |
| GO:0034113 | heterotypic cell-cell adhesion | 3.633523 | 0.0000636 | 0.0019436 | 10/16 |
| GO:0006413 | translational initiation | 3.544900 | 0.0000000 | 0.0000000 | 100/164 |
| GO:0002181 | cytoplasmic translation | 3.535319 | 0.0000000 | 0.0000000 | 45/74 |
| GO:0042116 | macrophage activation | 3.045238 | 0.0002418 | 0.0056219 | 11/21 |
| GO:0090150 | establishment of protein localization to membrane | 2.920998 | 0.0000000 | 0.0000000 | 103/205 |
| GO:0006959 | humoral immune response | 2.906818 | 0.0000109 | 0.0005306 | 17/34 |
| GO:0070671 | response to interleukin-12 | 2.657662 | 0.0000799 | 0.0020917 | 16/35 |
| GO:0033627 | cell adhesion mediated by integrin | 2.616136 | 0.0034849 | 0.0402478 | 9/20 |
| GO:0070265 | necrotic cell death | 2.558000 | 0.0015676 | 0.0220968 | 11/25 |
| GO:0006605 | protein targeting | 2.536451 | 0.0000000 | 0.0000000 | 113/259 |
| GO:0006401 | RNA catabolic process | 2.475337 | 0.0000000 | 0.0000000 | 109/256 |
| GO:0034341 | response to interferon-gamma | 2.440292 | 0.0000001 | 0.0000104 | 34/81 |
| GO:1901264 | carbohydrate derivative transport | 2.422349 | 0.0041432 | 0.0453276 | 10/24 |
| GO:0030101 | natural killer cell activation | 2.405643 | 0.0018436 | 0.0250255 | 12/29 |
| GO:0046683 | response to organophosphorus | 2.393850 | 0.0008278 | 0.0135372 | 14/34 |
| GO:0048013 | ephrin receptor signaling pathway | 2.361790 | 0.0014686 | 0.0215292 | 13/32 |
| GO:0006909 | phagocytosis | 2.271996 | 0.0000009 | 0.0000579 | 34/87 |
| GO:0014074 | response to purine-containing compound | 2.260859 | 0.0016098 | 0.0222633 | 14/36 |
| GO:0032609 | interferon-gamma production | 2.222861 | 0.0028036 | 0.0342507 | 13/34 |
| GO:0008037 | cell recognition | 2.199754 | 0.0021873 | 0.0285736 | 14/37 |
| GO:0001906 | cell killing | 2.180114 | 0.0002172 | 0.0053061 | 21/56 |
| GO:1902600 | proton transmembrane transport | 2.161480 | 0.0000174 | 0.0006708 | 29/78 |
| GO:0038061 | NIK/NF-kappaB signaling | 2.039872 | 0.0008311 | 0.0135372 | 20/57 |
| GO:0007159 | leukocyte cell-cell adhesion | 2.038548 | 0.0000000 | 0.0000047 | 54/154 |
| GO:0050900 | leukocyte migration | 2.022134 | 0.0000033 | 0.0001835 | 40/115 |
| GeneSet | description | enrichmentRatio | pValue | FDR | GeneRatio |
|---|---|---|---|---|---|
| GO:1990868 | response to chemokine | 5.384391 | 0.0000000 | 0.0000004 | 13/16 |
| GO:0002507 | tolerance induction | 4.819595 | 0.0000281 | 0.0005141 | 8/11 |
| GO:0050918 | positive chemotaxis | 4.217145 | 0.0003282 | 0.0036850 | 7/11 |
| GO:0034113 | heterotypic cell-cell adhesion | 4.141839 | 0.0000195 | 0.0003665 | 10/16 |
| GO:0098742 | cell-cell adhesion via plasma-membrane adhesion molecules | 3.976166 | 0.0000050 | 0.0001082 | 12/20 |
| GO:0001773 | myeloid dendritic cell activation | 3.976166 | 0.0000823 | 0.0012314 | 9/15 |
| GO:0007586 | digestion | 3.865717 | 0.0006855 | 0.0068833 | 7/12 |
| GO:0031579 | membrane raft organization | 3.865717 | 0.0006855 | 0.0068833 | 7/12 |
| GO:0045730 | respiratory burst | 3.865717 | 0.0006855 | 0.0068833 | 7/12 |
| GO:0140253 | cell-cell fusion | 3.727655 | 0.0001631 | 0.0020610 | 9/16 |
| GO:0006949 | syncytium formation | 3.508382 | 0.0003004 | 0.0034410 | 9/17 |
| GO:0060326 | cell chemotaxis | 3.502813 | 0.0000000 | 0.0000000 | 37/70 |
| GO:0032615 | interleukin-12 production | 3.487865 | 0.0001459 | 0.0019438 | 10/19 |
| GO:0006959 | humoral immune response | 3.313471 | 0.0000017 | 0.0000416 | 17/34 |
| GO:0033627 | cell adhesion mediated by integrin | 3.313471 | 0.0002526 | 0.0029861 | 10/20 |
| GO:0032602 | chemokine production | 3.313471 | 0.0005211 | 0.0056169 | 9/18 |
| GO:0044091 | membrane biogenesis | 3.313471 | 0.0047331 | 0.0277549 | 6/12 |
| GO:0002526 | acute inflammatory response | 3.190750 | 0.0000488 | 0.0008321 | 13/27 |
| GO:0007585 | respiratory gaseous exchange | 3.092573 | 0.0036786 | 0.0240752 | 7/15 |
| GO:0032613 | interleukin-10 production | 3.092573 | 0.0036786 | 0.0240752 | 7/15 |
| GO:0050920 | regulation of chemotaxis | 2.988621 | 0.0000003 | 0.0000096 | 23/51 |
| GO:0050900 | leukocyte migration | 2.938905 | 0.0000000 | 0.0000000 | 51/115 |
| GO:0032609 | interferon-gamma production | 2.923651 | 0.0000466 | 0.0008134 | 15/34 |
| GO:0050866 | negative regulation of cell activation | 2.920348 | 0.0000001 | 0.0000035 | 26/59 |
| GO:0002437 | inflammatory response to antigenic stimulus | 2.899288 | 0.0056997 | 0.0326399 | 7/16 |
| GO:0031529 | ruffle organization | 2.881280 | 0.0010167 | 0.0086653 | 10/23 |
| GO:0043062 | extracellular structure organization | 2.875843 | 0.0000006 | 0.0000196 | 23/53 |
| GO:0001906 | cell killing | 2.840118 | 0.0000005 | 0.0000154 | 24/56 |
| GO:0042116 | macrophage activation | 2.840118 | 0.0020576 | 0.0150825 | 9/21 |
| GO:0045576 | mast cell activation | 2.840118 | 0.0020576 | 0.0150825 | 9/21 |
| GO:0032612 | interleukin-1 production | 2.803707 | 0.0007541 | 0.0073700 | 11/26 |
| GO:0032637 | interleukin-8 production | 2.790292 | 0.0041677 | 0.0258895 | 8/19 |
| GO:0007229 | integrin-mediated signaling pathway | 2.779041 | 0.0002791 | 0.0032473 | 13/31 |
| GO:0030101 | natural killer cell activation | 2.742183 | 0.0005549 | 0.0058950 | 12/29 |
| GO:0008037 | cell recognition | 2.686599 | 0.0001509 | 0.0019746 | 15/37 |
| GO:0007159 | leukocyte cell-cell adhesion | 2.624958 | 0.0000000 | 0.0000000 | 61/154 |
| GO:0022407 | regulation of cell-cell adhesion | 2.617009 | 0.0000000 | 0.0000000 | 62/157 |
| GO:0050663 | cytokine secretion | 2.607322 | 0.0000031 | 0.0000734 | 24/61 |
| GO:0007162 | negative regulation of cell adhesion | 2.603442 | 0.0000000 | 0.0000022 | 33/84 |
| GO:0034109 | homotypic cell-cell adhesion | 2.603442 | 0.0015709 | 0.0122979 | 11/28 |
| GO:0032103 | positive regulation of response to external stimulus | 2.600446 | 0.0000001 | 0.0000047 | 31/79 |
| GO:0070661 | leukocyte proliferation | 2.530287 | 0.0000000 | 0.0000001 | 42/110 |
| GO:0009308 | amine metabolic process | 2.524550 | 0.0084956 | 0.0450500 | 8/21 |
| GO:0002791 | regulation of peptide secretion | 2.522195 | 0.0000000 | 0.0000000 | 51/134 |
| GO:0032635 | interleukin-6 production | 2.507492 | 0.0005807 | 0.0060812 | 14/37 |
| GO:0042110 | T cell activation | 2.488993 | 0.0000000 | 0.0000000 | 80/213 |
| GO:2001057 | reactive nitrogen species metabolic process | 2.485104 | 0.0059942 | 0.0340603 | 9/24 |
| GO:0034341 | response to interferon-gamma | 2.454423 | 0.0000008 | 0.0000231 | 30/81 |
| GO:0002250 | adaptive immune response | 2.422262 | 0.0000000 | 0.0000000 | 53/145 |
| GO:0071706 | tumor necrosis factor superfamily cytokine production | 2.421383 | 0.0001095 | 0.0015733 | 19/52 |
| GO:0070555 | response to interleukin-1 | 2.409797 | 0.0000784 | 0.0012220 | 20/55 |
| GO:0045785 | positive regulation of cell adhesion | 2.354309 | 0.0000000 | 0.0000000 | 54/152 |
| GO:0050867 | positive regulation of cell activation | 2.353045 | 0.0000000 | 0.0000001 | 49/138 |
| GO:0090130 | tissue migration | 2.343675 | 0.0000038 | 0.0000880 | 29/82 |
| GO:0046683 | response to organophosphorus | 2.338921 | 0.0028408 | 0.0194608 | 12/34 |
| GO:0002237 | response to molecule of bacterial origin | 2.322846 | 0.0000007 | 0.0000210 | 34/97 |
| GO:0031345 | negative regulation of cell projection organization | 2.305024 | 0.0007154 | 0.0070868 | 16/46 |
| GO:0070371 | ERK1 and ERK2 cascade | 2.293942 | 0.0000131 | 0.0002592 | 27/78 |
| GO:0002694 | regulation of leukocyte activation | 2.273009 | 0.0000000 | 0.0000000 | 71/207 |
| GO:0071887 | leukocyte apoptotic process | 2.255981 | 0.0009359 | 0.0083425 | 16/47 |
| GO:0001667 | ameboidal-type cell migration | 2.250660 | 0.0000008 | 0.0000229 | 36/106 |
| GO:0014074 | response to purine-containing compound | 2.208981 | 0.0048595 | 0.0282701 | 12/36 |
| GO:0033002 | muscle cell proliferation | 2.168818 | 0.0007812 | 0.0075342 | 18/55 |
| GO:0002449 | lymphocyte mediated immunity | 2.165239 | 0.0000061 | 0.0001284 | 33/101 |
| GO:0061448 | connective tissue development | 2.157609 | 0.0030990 | 0.0208399 | 14/43 |
| GO:0048872 | homeostasis of number of cells | 2.153757 | 0.0000010 | 0.0000268 | 39/120 |
| GO:1901342 | regulation of vasculature development | 2.149279 | 0.0001289 | 0.0018171 | 24/74 |
| GO:0002683 | negative regulation of immune system process | 2.139076 | 0.0000000 | 0.0000015 | 51/158 |
| GO:0002521 | leukocyte differentiation | 2.132432 | 0.0000000 | 0.0000000 | 65/202 |
| GO:0051271 | negative regulation of cellular component movement | 2.120622 | 0.0001631 | 0.0020610 | 24/75 |
| GO:1901568 | fatty acid derivative metabolic process | 2.114982 | 0.0027804 | 0.0192268 | 15/47 |
| GO:0051047 | positive regulation of secretion | 2.111238 | 0.0000045 | 0.0001001 | 36/113 |
| GO:0048771 | tissue remodeling | 2.092719 | 0.0078842 | 0.0428085 | 12/38 |
| GO:2000147 | positive regulation of cell motility | 2.062691 | 0.0000003 | 0.0000112 | 47/151 |
| GO:1903706 | regulation of hemopoiesis | 2.056637 | 0.0000000 | 0.0000022 | 54/174 |
| GO:0043491 | protein kinase B signaling | 2.039059 | 0.0009871 | 0.0086138 | 20/65 |
| GO:0010959 | regulation of metal ion transport | 2.033267 | 0.0001444 | 0.0019438 | 27/88 |
| GO:0030099 | myeloid cell differentiation | 2.027065 | 0.0000001 | 0.0000054 | 52/170 |
| GO:0019932 | second-messenger-mediated signaling | 2.010421 | 0.0001782 | 0.0021776 | 27/89 |
| GO:0031589 | cell-substrate adhesion | 2.010421 | 0.0001782 | 0.0021776 | 27/89 |
| GO:0032355 | response to estradiol | 2.003494 | 0.0086462 | 0.0450500 | 13/43 |
| GeneSet | description | enrichmentRatio | pValue | FDR | GeneRatio |
|---|---|---|---|---|---|
| GO:0010573 | vascular endothelial growth factor production | 3.065571 | 0.0024424 | 0.0223784 | 7/11 |
| GO:0050918 | positive chemotaxis | 3.065571 | 0.0024424 | 0.0223784 | 7/11 |
| GO:0034109 | homotypic cell-cell adhesion | 2.924805 | 0.0000045 | 0.0002007 | 17/28 |
| GO:0055123 | digestive system development | 2.846602 | 0.0000936 | 0.0021429 | 13/22 |
| GO:0140253 | cell-cell fusion | 2.709746 | 0.0019149 | 0.0184687 | 9/16 |
| GO:1990868 | response to chemokine | 2.709746 | 0.0019149 | 0.0184687 | 9/16 |
| GO:0030101 | natural killer cell activation | 2.657835 | 0.0000460 | 0.0012485 | 16/29 |
| GO:0043331 | response to dsRNA | 2.649529 | 0.0007668 | 0.0098610 | 11/20 |
| GO:0001773 | myeloid dendritic cell activation | 2.569240 | 0.0053303 | 0.0394659 | 8/15 |
| GO:0032613 | interleukin-10 production | 2.569240 | 0.0053303 | 0.0394659 | 8/15 |
| GO:0006949 | syncytium formation | 2.550349 | 0.0033266 | 0.0280276 | 9/17 |
| GO:0009581 | detection of external stimulus | 2.550349 | 0.0033266 | 0.0280276 | 9/17 |
| GO:0032609 | interferon-gamma production | 2.408663 | 0.0001371 | 0.0027915 | 17/34 |
| GO:0009582 | detection of abiotic stimulus | 2.408663 | 0.0054425 | 0.0396206 | 9/18 |
| GO:0031532 | actin cytoskeleton reorganization | 2.335673 | 0.0003391 | 0.0052878 | 16/33 |
| GO:0007229 | integrin-mediated signaling pathway | 2.330964 | 0.0005338 | 0.0078256 | 15/31 |
| GO:0032970 | regulation of actin filament-based process | 2.307459 | 0.0000000 | 0.0000000 | 57/119 |
| GO:0007015 | actin filament organization | 2.295757 | 0.0000000 | 0.0000000 | 61/128 |
| GO:0002576 | platelet degranulation | 2.288230 | 0.0001346 | 0.0027915 | 19/40 |
| GO:0060326 | cell chemotaxis | 2.271025 | 0.0000006 | 0.0000319 | 33/70 |
| GO:0032612 | interleukin-1 production | 2.223381 | 0.0031783 | 0.0277348 | 12/26 |
| GO:0048771 | tissue remodeling | 2.155119 | 0.0007246 | 0.0097594 | 17/38 |
| GO:0050900 | leukocyte migration | 2.094489 | 0.0000000 | 0.0000021 | 50/115 |
| GO:0043062 | extracellular structure organization | 2.090538 | 0.0001542 | 0.0029748 | 23/53 |
| GO:0031214 | biomineral tissue development | 2.087508 | 0.0042619 | 0.0328841 | 13/30 |
| GO:0032635 | interleukin-6 production | 2.083168 | 0.0016109 | 0.0166552 | 16/37 |
| GO:0042110 | T cell activation | 2.058106 | 0.0000000 | 0.0000000 | 91/213 |
| GO:0048017 | inositol lipid-mediated signaling | 2.016555 | 0.0013227 | 0.0149157 | 18/43 |
| GO:0070555 | response to interleukin-1 | 2.014518 | 0.0003005 | 0.0047892 | 23/55 |
| GO:1902903 | regulation of supramolecular fiber organization | 2.013800 | 0.0000001 | 0.0000044 | 51/122 |
| GO:0032103 | positive regulation of response to external stimulus | 2.012301 | 0.0000160 | 0.0005338 | 33/79 |
| GeneSet | description | enrichmentRatio | pValue | FDR | GeneRatio |
|---|---|---|---|---|---|
| GO:0032069 | regulation of nuclease activity | 2.680873 | 0.0018180 | 0.0410341 | 9/15 |
| GO:0061641 | CENP-A containing chromatin organization | 2.647776 | 0.0000369 | 0.0027023 | 16/27 |
| GO:0051383 | kinetochore organization | 2.457467 | 0.0014951 | 0.0387048 | 11/20 |
| GO:0036297 | interstrand cross-link repair | 2.161995 | 0.0012330 | 0.0361509 | 15/31 |
| GO:0071103 | DNA conformation change | 2.113301 | 0.0000000 | 0.0000000 | 70/148 |
| GO:2000241 | regulation of reproductive process | 2.094432 | 0.0018474 | 0.0410341 | 15/32 |
| GO:0006260 | DNA replication | 2.003885 | 0.0000000 | 0.0000000 | 74/165 |
| GeneSet | description | enrichmentRatio | pValue | FDR | GeneRatio |
|---|---|---|---|---|---|
| GO:0002507 | tolerance induction | 4.382482 | 0.0000575 | 0.0011596 | 8/11 |
| GO:0034113 | heterotypic cell-cell adhesion | 4.142815 | 0.0000048 | 0.0001767 | 11/16 |
| GO:0032633 | interleukin-4 production | 3.615548 | 0.0001771 | 0.0028845 | 9/15 |
| GO:0042092 | type 2 immune response | 3.615548 | 0.0023564 | 0.0179923 | 6/10 |
| GO:0032612 | interleukin-1 production | 3.244722 | 0.0000146 | 0.0004411 | 14/26 |
| GO:0032963 | collagen metabolic process | 3.171533 | 0.0003292 | 0.0042056 | 10/19 |
| GO:1904019 | epithelial cell apoptotic process | 3.124547 | 0.0000258 | 0.0006298 | 14/27 |
| GO:0033627 | cell adhesion mediated by integrin | 3.012956 | 0.0005613 | 0.0062341 | 10/20 |
| GO:0002437 | inflammatory response to antigenic stimulus | 3.012956 | 0.0020512 | 0.0170855 | 8/16 |
| GO:1990868 | response to chemokine | 3.012956 | 0.0020512 | 0.0170855 | 8/16 |
| GO:0030048 | actin filament-based movement | 2.892438 | 0.0002551 | 0.0037392 | 12/25 |
| GO:0043062 | extracellular structure organization | 2.842412 | 0.0000002 | 0.0000172 | 25/53 |
| GO:0006959 | humoral immune response | 2.835724 | 0.0000326 | 0.0007233 | 16/34 |
| GO:0032609 | interferon-gamma production | 2.835724 | 0.0000326 | 0.0007233 | 16/34 |
| GO:0001773 | myeloid dendritic cell activation | 2.812093 | 0.0063652 | 0.0392073 | 7/15 |
| GO:0034109 | homotypic cell-cell adhesion | 2.797745 | 0.0002145 | 0.0032753 | 13/28 |
| GO:0007229 | integrin-mediated signaling pathway | 2.721380 | 0.0001770 | 0.0028845 | 14/31 |
| GO:0001906 | cell killing | 2.690140 | 0.0000007 | 0.0000465 | 25/56 |
| GO:0050663 | cytokine secretion | 2.568422 | 0.0000013 | 0.0000705 | 26/61 |
| GO:0071706 | tumor necrosis factor superfamily cytokine production | 2.549425 | 0.0000096 | 0.0003341 | 22/52 |
| GO:0032615 | interleukin-12 production | 2.537227 | 0.0075710 | 0.0436972 | 8/19 |
| GO:0035456 | response to interferon-beta | 2.537227 | 0.0075710 | 0.0436972 | 8/19 |
| GO:0045445 | myoblast differentiation | 2.510797 | 0.0031575 | 0.0224704 | 10/24 |
| GO:0060326 | cell chemotaxis | 2.496450 | 0.0000006 | 0.0000461 | 29/70 |
| GO:0030101 | natural killer cell activation | 2.493481 | 0.0013347 | 0.0122295 | 12/29 |
| GO:0032635 | interleukin-6 production | 2.442938 | 0.0004444 | 0.0052542 | 15/37 |
| GO:0002576 | platelet degranulation | 2.410365 | 0.0003456 | 0.0042934 | 16/40 |
| GO:0070265 | necrotic cell death | 2.410365 | 0.0044935 | 0.0291480 | 10/25 |
| GO:0048771 | tissue remodeling | 2.378650 | 0.0006234 | 0.0068207 | 15/38 |
| GO:0050900 | leukocyte migration | 2.357966 | 0.0000000 | 0.0000011 | 45/115 |
| GO:0050866 | negative regulation of cell activation | 2.349085 | 0.0000301 | 0.0007111 | 23/59 |
| GO:0051341 | regulation of oxidoreductase activity | 2.332611 | 0.0026320 | 0.0192927 | 12/31 |
| GO:0034341 | response to interferon-gamma | 2.306214 | 0.0000020 | 0.0000916 | 31/81 |
| GO:0046683 | response to organophosphorus | 2.304025 | 0.0020098 | 0.0170855 | 13/34 |
| GO:0034340 | response to type I interferon | 2.276456 | 0.0005047 | 0.0057805 | 17/45 |
| GO:0002791 | regulation of peptide secretion | 2.248475 | 0.0000000 | 0.0000011 | 50/134 |
| GO:0043491 | protein kinase B signaling | 2.224952 | 0.0000576 | 0.0011596 | 24/65 |
| GO:0034612 | response to tumor necrosis factor | 2.203022 | 0.0000022 | 0.0000916 | 34/93 |
| GO:0014074 | response to purine-containing compound | 2.176024 | 0.0036251 | 0.0246037 | 13/36 |
| GO:0002237 | response to molecule of bacterial origin | 2.174298 | 0.0000022 | 0.0000916 | 35/97 |
| GO:0031032 | actomyosin structure organization | 2.169329 | 0.0006855 | 0.0072818 | 18/50 |
| GO:0002449 | lymphocyte mediated immunity | 2.147850 | 0.0000022 | 0.0000916 | 36/101 |
| GO:0071216 | cellular response to biotic stimulus | 2.146215 | 0.0000585 | 0.0011596 | 26/73 |
| GO:0032103 | positive regulation of response to external stimulus | 2.135767 | 0.0000339 | 0.0007313 | 28/79 |
| GO:0050920 | regulation of chemotaxis | 2.126793 | 0.0008983 | 0.0088951 | 18/51 |
| GO:0015850 | organic hydroxy compound transport | 2.054289 | 0.0034844 | 0.0243246 | 15/44 |
| GO:0042445 | hormone metabolic process | 2.051375 | 0.0026263 | 0.0192927 | 16/47 |
| GO:0001818 | negative regulation of cytokine production | 2.050053 | 0.0000185 | 0.0005011 | 33/97 |
| GO:0002250 | adaptive immune response | 2.036343 | 0.0000002 | 0.0000181 | 49/145 |
| GO:0050817 | coagulation | 2.029134 | 0.0000235 | 0.0005941 | 33/98 |
| GO:0002683 | negative regulation of immune system process | 2.021351 | 0.0000001 | 0.0000114 | 53/158 |
| GO:0006909 | phagocytosis | 2.008638 | 0.0000898 | 0.0016448 | 29/87 |
| GO:0009914 | hormone transport | 2.008638 | 0.0001183 | 0.0021149 | 28/84 |
| GO:0070371 | ERK1 and ERK2 cascade | 2.008638 | 0.0002056 | 0.0032753 | 26/78 |
| GO:0009612 | response to mechanical stimulus | 2.008638 | 0.0008233 | 0.0082665 | 21/63 |
| GO:0060485 | mesenchyme development | 2.008638 | 0.0019048 | 0.0164259 | 18/54 |
| GO:0003007 | heart morphogenesis | 2.008638 | 0.0044435 | 0.0290809 | 15/45 |
| GeneSet | description | enrichmentRatio | pValue | FDR | GeneRatio |
|---|---|---|---|---|---|
| GO:0050918 | positive chemotaxis | 4.528006 | 0.0002075 | 0.0089090 | 7/11 |
| GO:0051383 | kinetochore organization | 3.201947 | 0.0007993 | 0.0225341 | 9/20 |
| GO:1904888 | cranial skeletal system development | 3.201947 | 0.0007993 | 0.0225341 | 9/20 |
| GO:0007292 | female gamete generation | 2.776756 | 0.0000652 | 0.0034137 | 16/41 |
| GO:0006720 | isoprenoid metabolic process | 2.736707 | 0.0017813 | 0.0373059 | 10/26 |
| GO:0055088 | lipid homeostasis | 2.736707 | 0.0017813 | 0.0373059 | 10/26 |
| GO:1902850 | microtubule cytoskeleton organization involved in mitosis | 2.730342 | 0.0000000 | 0.0000028 | 33/86 |
| GO:0051321 | meiotic cell cycle | 2.511331 | 0.0000000 | 0.0000064 | 36/102 |
| GO:0008202 | steroid metabolic process | 2.502132 | 0.0000003 | 0.0000274 | 32/91 |
| GO:0050000 | chromosome localization | 2.458060 | 0.0000981 | 0.0047917 | 19/55 |
| GO:0070671 | response to interleukin-12 | 2.439579 | 0.0020285 | 0.0413017 | 12/35 |
| GO:0007051 | spindle organization | 2.371813 | 0.0000003 | 0.0000274 | 35/105 |
| GO:0000910 | cytokinesis | 2.371813 | 0.0000035 | 0.0002117 | 29/87 |
| GO:0051302 | regulation of cell division | 2.330919 | 0.0002188 | 0.0089090 | 19/58 |
| GO:0048285 | organelle fission | 2.274607 | 0.0000000 | 0.0000000 | 78/244 |
| GO:0007059 | chromosome segregation | 2.268690 | 0.0000000 | 0.0000000 | 66/207 |
| GO:0044839 | cell cycle G2/M phase transition | 2.193481 | 0.0000004 | 0.0000274 | 41/133 |
| GO:0034502 | protein localization to chromosome | 2.099638 | 0.0012918 | 0.0295913 | 18/61 |
| GO:1901615 | organic hydroxy compound metabolic process | 2.098798 | 0.0000014 | 0.0000912 | 41/139 |
| GO:0022412 | cellular process involved in reproduction in multicellular organism | 2.043796 | 0.0001453 | 0.0066550 | 27/94 |
| GeneSet | description | enrichmentRatio | pValue | FDR | GeneRatio |
|---|---|---|---|---|---|
| GO:0070972 | protein localization to endoplasmic reticulum | 2.831150 | 0.0000000 | 0.0000000 | 76/121 |
| GO:0006413 | translational initiation | 2.226260 | 0.0000000 | 0.0000000 | 81/164 |
| GO:0070671 | response to interleukin-12 | 2.189352 | 0.0004993 | 0.0192614 | 17/35 |
| GO:1902600 | proton transmembrane transport | 2.138168 | 0.0000006 | 0.0000501 | 37/78 |
| GO:0002181 | cytoplasmic translation | 2.131921 | 0.0000014 | 0.0000901 | 35/74 |
| GO:0010257 | NADH dehydrogenase complex assembly | 2.098314 | 0.0000314 | 0.0017693 | 27/58 |
| GeneSet | description | enrichmentRatio | pValue | FDR | GeneRatio |
|---|---|---|---|---|---|
| GO:0051131 | chaperone-mediated protein complex assembly | 3.768692 | 0.0002352 | 0.0123156 | 8/12 |
| GO:0051187 | cofactor catabolic process | 2.975284 | 0.0005635 | 0.0236871 | 10/19 |
| GO:0070972 | protein localization to endoplasmic reticulum | 2.756440 | 0.0000000 | 0.0000000 | 59/121 |
| GO:0006457 | protein folding | 2.558310 | 0.0000000 | 0.0000000 | 62/137 |
| GO:0008037 | cell recognition | 2.291772 | 0.0008970 | 0.0311737 | 15/37 |
| GO:0001906 | cell killing | 2.018942 | 0.0009276 | 0.0311737 | 20/56 |
| GeneSet | description | enrichmentRatio | pValue | FDR | GeneRatio |
|---|---|---|---|---|---|
| GO:0007200 | phospholipase C-activating G protein-coupled receptor signaling pathway | 6.558974 | 0.0000866 | 0.0012450 | 6/10 |
| GO:0034113 | heterotypic cell-cell adhesion | 6.149038 | 0.0000027 | 0.0000748 | 9/16 |
| GO:0050918 | positive chemotaxis | 5.962704 | 0.0001759 | 0.0021864 | 6/11 |
| GO:0055094 | response to lipoprotein particle | 5.465812 | 0.0010712 | 0.0095752 | 5/10 |
| GO:0071402 | cellular response to lipoprotein particle stimulus | 5.465812 | 0.0010712 | 0.0095752 | 5/10 |
| GO:0006959 | humoral immune response | 5.465812 | 0.0000000 | 0.0000000 | 17/34 |
| GO:0002437 | inflammatory response to antigenic stimulus | 5.465812 | 0.0000307 | 0.0005926 | 8/16 |
| GO:0003170 | heart valve development | 5.045365 | 0.0005568 | 0.0056389 | 6/13 |
| GO:0030101 | natural killer cell activation | 4.900383 | 0.0000005 | 0.0000153 | 13/29 |
| GO:0042116 | macrophage activation | 4.684982 | 0.0000449 | 0.0007647 | 9/21 |
| GO:0001906 | cell killing | 4.489774 | 0.0000000 | 0.0000000 | 23/56 |
| GO:0033627 | cell adhesion mediated by integrin | 4.372650 | 0.0002161 | 0.0025142 | 8/20 |
| GO:0032633 | interleukin-4 production | 4.372650 | 0.0013851 | 0.0120711 | 6/15 |
| GO:0032609 | interferon-gamma production | 4.179739 | 0.0000041 | 0.0001113 | 13/34 |
| GO:0002526 | acute inflammatory response | 4.048750 | 0.0000752 | 0.0011486 | 10/27 |
| GO:0032615 | interleukin-12 production | 4.027440 | 0.0009732 | 0.0090301 | 7/19 |
| GO:0007187 | G protein-coupled receptor signaling pathway, coupled to cyclic nucleotide second messenger | 4.008262 | 0.0000365 | 0.0006519 | 11/30 |
| GO:0043062 | extracellular structure organization | 3.918884 | 0.0000001 | 0.0000031 | 19/53 |
| GO:0001570 | vasculogenesis | 3.904151 | 0.0062469 | 0.0391812 | 5/14 |
| GO:0006720 | isoprenoid metabolic process | 3.784024 | 0.0003143 | 0.0034543 | 9/26 |
| GO:0032612 | interleukin-1 production | 3.784024 | 0.0003143 | 0.0034543 | 9/26 |
| GO:0034341 | response to interferon-gamma | 3.778833 | 0.0000000 | 0.0000000 | 28/81 |
| GO:0050866 | negative regulation of cell activation | 3.705635 | 0.0000001 | 0.0000039 | 20/59 |
| GO:2001057 | reactive nitrogen species metabolic process | 3.643875 | 0.0009080 | 0.0086434 | 8/24 |
| GO:0042110 | T cell activation | 3.592553 | 0.0000000 | 0.0000000 | 70/213 |
| GO:0070661 | leukocyte proliferation | 3.577622 | 0.0000000 | 0.0000000 | 36/110 |
| GO:0002449 | lymphocyte mediated immunity | 3.571719 | 0.0000000 | 0.0000000 | 33/101 |
| GO:0007159 | leukocyte cell-cell adhesion | 3.549228 | 0.0000000 | 0.0000000 | 50/154 |
| GO:0055123 | digestive system development | 3.478244 | 0.0025852 | 0.0201587 | 7/22 |
| GO:0035456 | response to interferon-beta | 3.452092 | 0.0054710 | 0.0358297 | 6/19 |
| GO:0051187 | cofactor catabolic process | 3.452092 | 0.0054710 | 0.0358297 | 6/19 |
| GO:0060191 | regulation of lipase activity | 3.452092 | 0.0054710 | 0.0358297 | 6/19 |
| GO:0022407 | regulation of cell-cell adhesion | 3.411781 | 0.0000000 | 0.0000000 | 49/157 |
| GO:0050727 | regulation of inflammatory response | 3.380915 | 0.0000000 | 0.0000000 | 30/97 |
| GO:0097696 | STAT cascade | 3.327016 | 0.0000364 | 0.0006519 | 14/46 |
| GO:0048017 | inositol lipid-mediated signaling | 3.304910 | 0.0000747 | 0.0011486 | 13/43 |
| GO:0060326 | cell chemotaxis | 3.279487 | 0.0000005 | 0.0000173 | 21/70 |
| GO:0098742 | cell-cell adhesion via plasma-membrane adhesion molecules | 3.279487 | 0.0072239 | 0.0437616 | 6/20 |
| GO:0008037 | cell recognition | 3.249942 | 0.0003157 | 0.0034543 | 11/37 |
| GO:0045785 | positive regulation of cell adhesion | 3.236336 | 0.0000000 | 0.0000000 | 45/152 |
| GO:0050900 | leukocyte migration | 3.231958 | 0.0000000 | 0.0000000 | 34/115 |
| GO:0050663 | cytokine secretion | 3.225725 | 0.0000046 | 0.0001165 | 18/61 |
| GO:0070371 | ERK1 and ERK2 cascade | 3.223428 | 0.0000002 | 0.0000077 | 23/78 |
| GO:0002694 | regulation of leukocyte activation | 3.221396 | 0.0000000 | 0.0000000 | 61/207 |
| GO:0050920 | regulation of chemotaxis | 3.215184 | 0.0000302 | 0.0005926 | 15/51 |
| GO:0007229 | integrin-mediated signaling pathway | 3.173697 | 0.0013395 | 0.0118295 | 9/31 |
| GO:0050867 | positive regulation of cell activation | 3.168587 | 0.0000000 | 0.0000000 | 40/138 |
| GO:0045165 | cell fate commitment | 3.164417 | 0.0004084 | 0.0044027 | 11/38 |
| GO:0071706 | tumor necrosis factor superfamily cytokine production | 3.153353 | 0.0000390 | 0.0006799 | 15/52 |
| GO:0034109 | homotypic cell-cell adhesion | 3.123321 | 0.0027660 | 0.0205503 | 8/28 |
| GO:0002065 | columnar/cuboidal epithelial cell differentiation | 3.060855 | 0.0057252 | 0.0364921 | 7/25 |
| GO:0032103 | positive regulation of response to external stimulus | 3.044250 | 0.0000012 | 0.0000352 | 22/79 |
| GO:0002250 | adaptive immune response | 3.015620 | 0.0000000 | 0.0000000 | 40/145 |
| GO:0003205 | cardiac chamber development | 3.015620 | 0.0035206 | 0.0250542 | 8/29 |
| GO:0009791 | post-embryonic development | 2.915100 | 0.0044253 | 0.0308926 | 8/30 |
| GO:0003158 | endothelium development | 2.893665 | 0.0027201 | 0.0205503 | 9/34 |
| GO:0030856 | regulation of epithelial cell differentiation | 2.876743 | 0.0016777 | 0.0135139 | 10/38 |
| GO:0043491 | protein kinase B signaling | 2.859040 | 0.0000485 | 0.0008076 | 17/65 |
| GO:0043583 | ear development | 2.802980 | 0.0020759 | 0.0165396 | 10/39 |
| GO:0032623 | interleukin-2 production | 2.732906 | 0.0067595 | 0.0419894 | 8/32 |
| GO:0002683 | negative regulation of immune system process | 2.698312 | 0.0000000 | 0.0000002 | 39/158 |
| GO:0031348 | negative regulation of defense response | 2.690861 | 0.0001760 | 0.0021864 | 16/65 |
| GO:0021915 | neural tube development | 2.666250 | 0.0030998 | 0.0224962 | 10/41 |
| GO:0002764 | immune response-regulating signaling pathway | 2.656283 | 0.0000000 | 0.0000000 | 52/214 |
| GO:0001819 | positive regulation of cytokine production | 2.629125 | 0.0000000 | 0.0000005 | 38/158 |
| GO:0032102 | negative regulation of response to external stimulus | 2.623590 | 0.0000998 | 0.0014066 | 18/75 |
| GO:0019932 | second-messenger-mediated signaling | 2.579372 | 0.0000350 | 0.0006519 | 21/89 |
| GO:0050817 | coagulation | 2.565585 | 0.0000163 | 0.0003859 | 23/98 |
| GO:0071887 | leukocyte apoptotic process | 2.558465 | 0.0027755 | 0.0205503 | 11/47 |
| GO:1901568 | fatty acid derivative metabolic process | 2.558465 | 0.0027755 | 0.0205503 | 11/47 |
| GO:0090130 | tissue migration | 2.532937 | 0.0001070 | 0.0014794 | 19/82 |
| GO:0006909 | phagocytosis | 2.513017 | 0.0000796 | 0.0011908 | 20/87 |
| GO:0002521 | leukocyte differentiation | 2.489380 | 0.0000000 | 0.0000001 | 46/202 |
| GO:0001667 | ameboidal-type cell migration | 2.475085 | 0.0000204 | 0.0004454 | 24/106 |
| GO:0007162 | negative regulation of cell adhesion | 2.472629 | 0.0001507 | 0.0019731 | 19/84 |
| GO:0002697 | regulation of immune effector process | 2.470846 | 0.0000006 | 0.0000180 | 33/146 |
| GO:0042113 | B cell activation | 2.429250 | 0.0000284 | 0.0005786 | 24/108 |
| GO:0002064 | epithelial cell development | 2.408663 | 0.0021202 | 0.0167104 | 13/59 |
| GO:0008202 | steroid metabolic process | 2.402555 | 0.0001547 | 0.0019896 | 20/91 |
| GO:0002285 | lymphocyte activation involved in immune response | 2.395972 | 0.0007196 | 0.0071277 | 16/73 |
| GO:0048872 | homeostasis of number of cells | 2.368518 | 0.0000213 | 0.0004454 | 26/120 |
| GO:0042063 | gliogenesis | 2.363594 | 0.0008426 | 0.0081262 | 16/74 |
| GO:0003013 | circulatory system process | 2.360237 | 0.0002875 | 0.0032932 | 19/88 |
| GO:0034612 | response to tumor necrosis factor | 2.350887 | 0.0002117 | 0.0025032 | 20/93 |
| GO:0072507 | divalent inorganic cation homeostasis | 2.324046 | 0.0000213 | 0.0004454 | 27/127 |
| GO:0031349 | positive regulation of defense response | 2.301394 | 0.0000045 | 0.0001165 | 32/152 |
| GO:0038061 | NIK/NF-kappaB signaling | 2.301394 | 0.0046233 | 0.0319704 | 12/57 |
| GO:0008544 | epidermis development | 2.292115 | 0.0033766 | 0.0242654 | 13/62 |
| GO:0045088 | regulation of innate immune response | 2.271506 | 0.0000061 | 0.0001486 | 32/154 |
| GO:0007015 | actin filament organization | 2.220486 | 0.0000689 | 0.0010982 | 26/128 |
| GO:0031589 | cell-substrate adhesion | 2.210890 | 0.0009440 | 0.0088708 | 18/89 |
| GO:0002791 | regulation of peptide secretion | 2.202641 | 0.0000580 | 0.0009450 | 27/134 |
| GO:0051271 | negative regulation of cellular component movement | 2.186325 | 0.0027611 | 0.0205503 | 15/75 |
| GO:0048871 | multicellular organismal homeostasis | 2.143456 | 0.0007586 | 0.0074143 | 20/102 |
| GO:0001818 | negative regulation of cytokine production | 2.141246 | 0.0010348 | 0.0094814 | 19/97 |
| GO:0050878 | regulation of body fluid levels | 2.137009 | 0.0001346 | 0.0017943 | 26/133 |
| GO:0019216 | regulation of lipid metabolic process | 2.135083 | 0.0001835 | 0.0022418 | 25/128 |
| GO:0051047 | positive regulation of secretion | 2.128281 | 0.0004645 | 0.0047960 | 22/113 |
| GO:0048880 | sensory system development | 2.102235 | 0.0040969 | 0.0288754 | 15/78 |
| GO:0001505 | regulation of neurotransmitter levels | 2.096476 | 0.0056078 | 0.0363180 | 14/73 |
| GO:0072593 | reactive oxygen species metabolic process | 2.077008 | 0.0015138 | 0.0127540 | 19/100 |
| GO:1902903 | regulation of supramolecular fiber organization | 2.060880 | 0.0005616 | 0.0056389 | 23/122 |
| GO:0002009 | morphogenesis of an epithelium | 2.043294 | 0.0014163 | 0.0120711 | 20/107 |
| GO:0018212 | peptidyl-tyrosine modification | 2.043294 | 0.0014163 | 0.0120711 | 20/107 |
| GO:0097305 | response to alcohol | 2.040570 | 0.0071799 | 0.0437616 | 14/75 |
| GO:0043087 | regulation of GTPase activity | 2.011955 | 0.0001325 | 0.0017943 | 30/163 |
| GeneSet | description | enrichmentRatio | pValue | FDR | GeneRatio |
|---|---|---|---|---|---|
| GO:0070972 | protein localization to endoplasmic reticulum | 8.072743 | 0.0000000 | 0.0000000 | 80/121 |
| GO:0006413 | translational initiation | 6.551720 | 0.0000000 | 0.0000000 | 88/164 |
| GO:0002181 | cytoplasmic translation | 6.270012 | 0.0000000 | 0.0000000 | 38/74 |
| GO:0050918 | positive chemotaxis | 5.550011 | 0.0010973 | 0.0161849 | 5/11 |
| GO:0090150 | establishment of protein localization to membrane | 5.181815 | 0.0000000 | 0.0000000 | 87/205 |
| GO:0031579 | membrane raft organization | 5.087510 | 0.0017556 | 0.0235669 | 5/12 |
| GO:0006959 | humoral immune response | 5.027657 | 0.0000001 | 0.0000111 | 14/34 |
| GO:0046939 | nucleotide phosphorylation | 4.440009 | 0.0000002 | 0.0000111 | 16/44 |
| GO:0006605 | protein targeting | 4.337151 | 0.0000000 | 0.0000000 | 92/259 |
| GO:0070206 | protein trimerization | 4.070008 | 0.0009926 | 0.0151582 | 7/21 |
| GO:0006401 | RNA catabolic process | 4.006414 | 0.0000000 | 0.0000000 | 84/256 |
| GO:0009132 | nucleoside diphosphate metabolic process | 3.991739 | 0.0000004 | 0.0000205 | 17/52 |
| GO:0006090 | pyruvate metabolic process | 3.916423 | 0.0000005 | 0.0000260 | 17/53 |
| GO:0048678 | response to axon injury | 3.663007 | 0.0041838 | 0.0471804 | 6/20 |
| GO:0016052 | carbohydrate catabolic process | 3.402794 | 0.0000045 | 0.0001661 | 17/61 |
| GO:0072524 | pyridine-containing compound metabolic process | 3.139720 | 0.0000082 | 0.0002845 | 18/70 |
| GO:0071887 | leukocyte apoptotic process | 3.117453 | 0.0002878 | 0.0062054 | 12/47 |
| GO:0050920 | regulation of chemotaxis | 3.112359 | 0.0001643 | 0.0037646 | 13/51 |
| GO:0034404 | nucleobase-containing small molecule biosynthetic process | 2.951874 | 0.0000025 | 0.0001066 | 22/91 |
| GO:0072522 | purine-containing compound biosynthetic process | 2.915827 | 0.0000000 | 0.0000017 | 32/134 |
| GO:0008637 | apoptotic mitochondrial changes | 2.872947 | 0.0000842 | 0.0021279 | 16/68 |
| GO:0048017 | inositol lipid-mediated signaling | 2.839540 | 0.0019903 | 0.0255952 | 10/43 |
| GO:0046434 | organophosphate catabolic process | 2.829152 | 0.0000232 | 0.0007085 | 19/82 |
| GO:1902600 | proton transmembrane transport | 2.817698 | 0.0000403 | 0.0010951 | 18/78 |
| GO:0060326 | cell chemotaxis | 2.790863 | 0.0001219 | 0.0029231 | 16/70 |
| GO:0090559 | regulation of membrane permeability | 2.713339 | 0.0028562 | 0.0337680 | 10/45 |
| GO:0070482 | response to oxygen levels | 2.703648 | 0.0000002 | 0.0000120 | 31/140 |
| GO:0046390 | ribose phosphate biosynthetic process | 2.662336 | 0.0000006 | 0.0000315 | 29/133 |
| GO:0035821 | modification of morphology or physiology of other organism | 2.560166 | 0.0012480 | 0.0179365 | 13/62 |
| GO:0070371 | ERK1 and ERK2 cascade | 2.504620 | 0.0004586 | 0.0085121 | 16/78 |
| GO:0043491 | protein kinase B signaling | 2.442005 | 0.0019675 | 0.0255952 | 13/65 |
| GO:0046677 | response to antibiotic | 2.422624 | 0.0000225 | 0.0007085 | 25/126 |
| GO:0005996 | monosaccharide metabolic process | 2.394122 | 0.0001764 | 0.0039188 | 20/102 |
| GO:0009123 | nucleoside monophosphate metabolic process | 2.382444 | 0.0000001 | 0.0000108 | 40/205 |
| GO:0009141 | nucleoside triphosphate metabolic process | 2.379389 | 0.0000003 | 0.0000157 | 38/195 |
| GO:0050900 | leukocyte migration | 2.335831 | 0.0001236 | 0.0029231 | 22/115 |
| GO:0007006 | mitochondrial membrane organization | 2.332252 | 0.0007340 | 0.0118971 | 17/89 |
| GO:1901293 | nucleoside phosphate biosynthetic process | 2.311957 | 0.0000045 | 0.0001661 | 32/169 |
| GO:0009636 | response to toxic substance | 2.232690 | 0.0000097 | 0.0003247 | 32/175 |
| GO:0097193 | intrinsic apoptotic signaling pathway | 2.226986 | 0.0000271 | 0.0007932 | 29/159 |
| GO:0071826 | ribonucleoprotein complex subunit organization | 2.214253 | 0.0000045 | 0.0001661 | 35/193 |
| GO:0010821 | regulation of mitochondrion organization | 2.162192 | 0.0017683 | 0.0235669 | 17/96 |
| GO:0048872 | homeostasis of number of cells | 2.136754 | 0.0006248 | 0.0111634 | 21/120 |
| GO:2001233 | regulation of apoptotic signaling pathway | 2.100649 | 0.0000353 | 0.0009954 | 32/186 |
| GO:0002791 | regulation of peptide secretion | 2.095750 | 0.0004645 | 0.0085121 | 23/134 |
| GO:0072331 | signal transduction by p53 class mediator | 2.082330 | 0.0006731 | 0.0112134 | 22/129 |
| GO:0016053 | organic acid biosynthetic process | 2.063666 | 0.0004445 | 0.0085121 | 24/142 |
| GO:0051188 | cofactor biosynthetic process | 2.049858 | 0.0006424 | 0.0111634 | 23/137 |
| GO:0070997 | neuron death | 2.035004 | 0.0009273 | 0.0144620 | 22/132 |
| GO:0022407 | regulation of cell-cell adhesion | 2.022042 | 0.0003608 | 0.0073458 | 26/157 |
| GeneSet | description | enrichmentRatio | pValue | FDR | GeneRatio |
|---|---|---|---|---|---|
| GO:1990868 | response to chemokine | 6.297046 | 0.0000022 | 0.0000658 | 9/16 |
| GO:0050918 | positive chemotaxis | 6.106226 | 0.0001539 | 0.0018802 | 6/11 |
| GO:0032633 | interleukin-4 production | 5.224216 | 0.0001478 | 0.0018365 | 7/15 |
| GO:0002507 | tolerance induction | 5.088522 | 0.0016313 | 0.0125864 | 5/11 |
| GO:0033627 | cell adhesion mediated by integrin | 5.037637 | 0.0000230 | 0.0004108 | 9/20 |
| GO:0032602 | chemokine production | 4.975444 | 0.0000746 | 0.0010937 | 8/18 |
| GO:0034113 | heterotypic cell-cell adhesion | 4.897702 | 0.0002427 | 0.0027973 | 7/16 |
| GO:0045730 | respiratory burst | 4.664479 | 0.0025931 | 0.0181021 | 5/12 |
| GO:0055123 | digestive system development | 4.579670 | 0.0000578 | 0.0009100 | 9/22 |
| GO:0090077 | foam cell differentiation | 4.477899 | 0.0085288 | 0.0453015 | 4/10 |
| GO:0001773 | myeloid dendritic cell activation | 4.477899 | 0.0012214 | 0.0098382 | 6/15 |
| GO:0003170 | heart valve development | 4.305672 | 0.0039080 | 0.0246947 | 5/13 |
| GO:0033028 | myeloid cell apoptotic process | 4.305672 | 0.0039080 | 0.0246947 | 5/13 |
| GO:0043062 | extracellular structure organization | 4.224433 | 0.0000000 | 0.0000006 | 20/53 |
| GO:0002437 | inflammatory response to antigenic stimulus | 4.198031 | 0.0018086 | 0.0132569 | 6/16 |
| GO:0007229 | integrin-mediated signaling pathway | 3.972330 | 0.0000416 | 0.0006928 | 11/31 |
| GO:0006959 | humoral immune response | 3.951088 | 0.0000197 | 0.0003707 | 12/34 |
| GO:0098742 | cell-cell adhesion via plasma-membrane adhesion molecules | 3.918162 | 0.0011987 | 0.0097629 | 7/20 |
| GO:0032623 | interleukin-2 production | 3.848195 | 0.0000583 | 0.0009100 | 11/32 |
| GO:0071887 | leukocyte apoptotic process | 3.810978 | 0.0000014 | 0.0000483 | 16/47 |
| GO:0042116 | macrophage activation | 3.731583 | 0.0016618 | 0.0126885 | 7/21 |
| GO:0046847 | filopodium assembly | 3.731583 | 0.0078481 | 0.0426120 | 5/15 |
| GO:0032103 | positive regulation of response to external stimulus | 3.684348 | 0.0000000 | 0.0000002 | 26/79 |
| GO:0060326 | cell chemotaxis | 3.678275 | 0.0000000 | 0.0000007 | 23/70 |
| GO:0002065 | columnar/cuboidal epithelial cell differentiation | 3.582320 | 0.0010513 | 0.0087864 | 8/25 |
| GO:0030101 | natural killer cell activation | 3.474232 | 0.0006595 | 0.0061977 | 9/29 |
| GO:0070555 | response to interleukin-1 | 3.460195 | 0.0000030 | 0.0000717 | 17/55 |
| GO:0002576 | platelet degranulation | 3.358424 | 0.0001221 | 0.0015646 | 12/40 |
| GO:0050900 | leukocyte migration | 3.309752 | 0.0000000 | 0.0000000 | 34/115 |
| GO:0045445 | myoblast differentiation | 3.265135 | 0.0039076 | 0.0246947 | 7/24 |
| GO:0050727 | regulation of inflammatory response | 3.231474 | 0.0000000 | 0.0000006 | 28/97 |
| GO:0009308 | amine metabolic process | 3.198500 | 0.0083391 | 0.0446171 | 6/21 |
| GO:0007159 | leukocyte cell-cell adhesion | 3.125806 | 0.0000000 | 0.0000000 | 43/154 |
| GO:0050663 | cytokine secretion | 3.119848 | 0.0000144 | 0.0002848 | 17/61 |
| GO:0050920 | regulation of chemotaxis | 3.073068 | 0.0000987 | 0.0013157 | 14/51 |
| GO:0002285 | lymphocyte activation involved in immune response | 3.067054 | 0.0000034 | 0.0000772 | 20/73 |
| GO:0070661 | leukocyte proliferation | 3.053113 | 0.0000000 | 0.0000007 | 30/110 |
| GO:0031532 | actin cytoskeleton reorganization | 3.053113 | 0.0018389 | 0.0133453 | 9/33 |
| GO:0050866 | negative regulation of cell activation | 3.035864 | 0.0000373 | 0.0006356 | 16/59 |
| GO:0070371 | ERK1 and ERK2 cascade | 3.013971 | 0.0000026 | 0.0000682 | 21/78 |
| GO:0032612 | interleukin-1 production | 3.013971 | 0.0063508 | 0.0355351 | 7/26 |
| GO:0072507 | divalent inorganic cation homeostasis | 2.997019 | 0.0000000 | 0.0000002 | 34/127 |
| GO:0031214 | biomineral tissue development | 2.985266 | 0.0038195 | 0.0246947 | 8/30 |
| GO:0038061 | NIK/NF-kappaB signaling | 2.945986 | 0.0000951 | 0.0012908 | 15/57 |
| GO:0042110 | T cell activation | 2.943220 | 0.0000000 | 0.0000000 | 56/213 |
| GO:0007162 | negative regulation of cell adhesion | 2.931958 | 0.0000025 | 0.0000676 | 22/84 |
| GO:0022407 | regulation of cell-cell adhesion | 2.923469 | 0.0000000 | 0.0000000 | 41/157 |
| GO:0002526 | acute inflammatory response | 2.902342 | 0.0079297 | 0.0427387 | 7/27 |
| GO:0050867 | positive regulation of cell activation | 2.839248 | 0.0000000 | 0.0000005 | 35/138 |
| GO:0045785 | positive regulation of cell adhesion | 2.798687 | 0.0000000 | 0.0000002 | 38/152 |
| GO:0001906 | cell killing | 2.798687 | 0.0002921 | 0.0031951 | 14/56 |
| GO:0007272 | ensheathment of neurons | 2.798687 | 0.0058571 | 0.0338049 | 8/32 |
| GO:2000241 | regulation of reproductive process | 2.798687 | 0.0058571 | 0.0338049 | 8/32 |
| GO:0034109 | homotypic cell-cell adhesion | 2.798687 | 0.0097802 | 0.0497842 | 7/28 |
| GO:0001667 | ameboidal-type cell migration | 2.745882 | 0.0000012 | 0.0000461 | 26/106 |
| GO:0009615 | response to virus | 2.741571 | 0.0000000 | 0.0000006 | 36/147 |
| GO:0034340 | response to type I interferon | 2.736494 | 0.0015767 | 0.0123055 | 11/45 |
| GO:0090130 | tissue migration | 2.730426 | 0.0000227 | 0.0004108 | 20/82 |
| GO:0002521 | leukocyte differentiation | 2.715558 | 0.0000000 | 0.0000000 | 49/202 |
| GO:0051271 | negative regulation of cellular component movement | 2.686740 | 0.0000731 | 0.0010937 | 18/75 |
| GO:0001655 | urogenital system development | 2.665416 | 0.0003186 | 0.0034345 | 15/63 |
| GO:0030856 | regulation of epithelial cell differentiation | 2.651388 | 0.0052011 | 0.0312495 | 9/38 |
| GO:0033002 | muscle cell proliferation | 2.646031 | 0.0008532 | 0.0077209 | 13/55 |
| GO:0031589 | cell-substrate adhesion | 2.641458 | 0.0000244 | 0.0004258 | 21/89 |
| GO:0003158 | endothelium development | 2.634058 | 0.0086307 | 0.0455132 | 8/34 |
| GO:0002250 | adaptive immune response | 2.624976 | 0.0000001 | 0.0000037 | 34/145 |
| GO:0048872 | homeostasis of number of cells | 2.612108 | 0.0000014 | 0.0000483 | 28/120 |
| GO:0002244 | hematopoietic progenitor cell differentiation | 2.603430 | 0.0037812 | 0.0246947 | 10/43 |
| GO:0044706 | multi-multicellular organism process | 2.598781 | 0.0010228 | 0.0087179 | 13/56 |
| GO:0043583 | ear development | 2.583404 | 0.0062413 | 0.0355351 | 9/39 |
| GO:0051235 | maintenance of location | 2.575783 | 0.0000043 | 0.0000966 | 26/113 |
| GO:0032102 | negative regulation of response to external stimulus | 2.537476 | 0.0002442 | 0.0027973 | 17/75 |
| GO:2000027 | regulation of animal organ morphogenesis | 2.518818 | 0.0074343 | 0.0406668 | 9/40 |
| GO:1903706 | regulation of hemopoiesis | 2.509168 | 0.0000000 | 0.0000016 | 39/174 |
| GO:0002694 | regulation of leukocyte activation | 2.487722 | 0.0000000 | 0.0000002 | 46/207 |
| GO:0001503 | ossification | 2.460384 | 0.0001114 | 0.0014575 | 20/91 |
| GO:0007015 | actin filament organization | 2.448851 | 0.0000053 | 0.0001115 | 28/128 |
| GO:0072511 | divalent inorganic cation transport | 2.433641 | 0.0000192 | 0.0003700 | 25/115 |
| GO:0097696 | STAT cascade | 2.433641 | 0.0063084 | 0.0355351 | 10/46 |
| GO:0001818 | negative regulation of cytokine production | 2.423605 | 0.0000949 | 0.0012908 | 21/97 |
| GO:0002791 | regulation of peptide secretion | 2.422744 | 0.0000045 | 0.0000976 | 29/134 |
| GO:1901342 | regulation of vasculature development | 2.420486 | 0.0006489 | 0.0061773 | 16/74 |
| GO:0010959 | regulation of metal ion transport | 2.417048 | 0.0002111 | 0.0024953 | 19/88 |
| GO:0040013 | negative regulation of locomotion | 2.408997 | 0.0004700 | 0.0047195 | 17/79 |
| GO:0042445 | hormone metabolic process | 2.381861 | 0.0073925 | 0.0406668 | 10/47 |
| GO:0098542 | defense response to other organism | 2.372397 | 0.0000023 | 0.0000658 | 32/151 |
| GO:2000147 | positive regulation of cell motility | 2.372397 | 0.0000023 | 0.0000658 | 32/151 |
| GO:0007219 | Notch signaling pathway | 2.368120 | 0.0053003 | 0.0313316 | 11/52 |
| GO:0031349 | positive regulation of defense response | 2.356789 | 0.0000027 | 0.0000684 | 32/152 |
| GO:0002831 | regulation of response to biotic stimulus | 2.356789 | 0.0038073 | 0.0246947 | 12/57 |
| GO:0034341 | response to interferon-gamma | 2.349515 | 0.0006386 | 0.0061773 | 17/81 |
| GO:0035821 | modification of morphology or physiology of other organism | 2.347286 | 0.0027389 | 0.0189397 | 13/62 |
| GO:0001525 | angiogenesis | 2.316155 | 0.0000660 | 0.0010078 | 24/116 |
| GO:0002237 | response to molecule of bacterial origin | 2.308196 | 0.0002794 | 0.0031030 | 20/97 |
| GO:0043900 | regulation of multi-organism process | 2.306797 | 0.0000022 | 0.0000658 | 34/165 |
| GO:0009636 | response to toxic substance | 2.302920 | 0.0000011 | 0.0000461 | 36/175 |
| GO:0034612 | response to tumor necrosis factor | 2.287099 | 0.0004466 | 0.0045463 | 19/93 |
| GO:0097191 | extrinsic apoptotic signaling pathway | 2.287099 | 0.0004466 | 0.0045463 | 19/93 |
| GO:0042113 | B cell activation | 2.280412 | 0.0001684 | 0.0020237 | 22/108 |
| GO:0001819 | positive regulation of cytokine production | 2.267291 | 0.0000065 | 0.0001320 | 32/158 |
| GO:0043491 | protein kinase B signaling | 2.238950 | 0.0042278 | 0.0262627 | 13/65 |
| GO:0043270 | positive regulation of ion transport | 2.198968 | 0.0094426 | 0.0484017 | 11/56 |
| GO:0002009 | morphogenesis of an epithelium | 2.197100 | 0.0004037 | 0.0042278 | 21/107 |
| GO:0032970 | regulation of actin filament-based process | 2.163691 | 0.0002737 | 0.0030870 | 23/119 |
| GO:0003013 | circulatory system process | 2.162622 | 0.0016954 | 0.0128116 | 17/88 |
| GO:0002764 | immune response-regulating signaling pathway | 2.144788 | 0.0000014 | 0.0000483 | 41/214 |
| GO:1902532 | negative regulation of intracellular signal transduction | 2.140172 | 0.0000028 | 0.0000684 | 39/204 |
| GO:0019932 | second-messenger-mediated signaling | 2.138323 | 0.0019274 | 0.0138511 | 17/89 |
| GO:0002683 | negative regulation of immune system process | 2.125585 | 0.0000468 | 0.0007622 | 30/158 |
| GO:0048568 | embryonic organ development | 2.121110 | 0.0015781 | 0.0123055 | 18/95 |
| GO:0042063 | gliogenesis | 2.117925 | 0.0051505 | 0.0312495 | 14/74 |
| GO:0002449 | lymphocyte mediated immunity | 2.105943 | 0.0012907 | 0.0102839 | 19/101 |
| GO:0052547 | regulation of peptidase activity | 2.094501 | 0.0000827 | 0.0011663 | 29/155 |
| GO:0018212 | peptidyl-tyrosine modification | 2.092476 | 0.0010548 | 0.0087864 | 20/107 |
| GO:0006909 | phagocytosis | 2.058804 | 0.0038600 | 0.0246947 | 16/87 |
| GO:0045861 | negative regulation of proteolysis | 2.052370 | 0.0007909 | 0.0072470 | 22/120 |
| GO:0046677 | response to antibiotic | 2.043486 | 0.0006444 | 0.0061773 | 23/126 |
| GO:0030099 | myeloid cell differentiation | 2.041395 | 0.0000783 | 0.0011260 | 31/170 |
| GO:1902903 | regulation of supramolecular fiber organization | 2.018725 | 0.0009958 | 0.0087179 | 22/122 |
| GO:0072593 | reactive oxygen species metabolic process | 2.015055 | 0.0028632 | 0.0194325 | 18/100 |
| GeneSet | description | enrichmentRatio | pValue | FDR | GeneRatio |
|---|---|---|---|---|---|
| GO:0045730 | respiratory burst | 6.538855 | 0.0005558 | 0.0079333 | 5/12 |
| GO:0042092 | type 2 immune response | 6.277301 | 0.0024994 | 0.0277763 | 4/10 |
| GO:0070265 | necrotic cell death | 5.021840 | 0.0001035 | 0.0022311 | 8/25 |
| GO:0034341 | response to interferon-gamma | 4.456109 | 0.0000000 | 0.0000001 | 23/81 |
| GO:0032602 | chemokine production | 4.359236 | 0.0043757 | 0.0445469 | 5/18 |
| GO:0030101 | natural killer cell activation | 4.329173 | 0.0003279 | 0.0054633 | 8/29 |
| GO:0070972 | protein localization to endoplasmic reticulum | 4.279978 | 0.0000000 | 0.0000000 | 33/121 |
| GO:0060326 | cell chemotaxis | 4.259597 | 0.0000000 | 0.0000033 | 19/70 |
| GO:0032612 | interleukin-1 production | 4.225106 | 0.0009153 | 0.0119807 | 7/26 |
| GO:0006959 | humoral immune response | 4.154096 | 0.0001961 | 0.0034224 | 9/34 |
| GO:0050920 | regulation of chemotaxis | 4.000241 | 0.0000118 | 0.0003745 | 13/51 |
| GO:0001906 | cell killing | 3.923313 | 0.0000069 | 0.0002664 | 14/56 |
| GO:0034109 | homotypic cell-cell adhesion | 3.923313 | 0.0014752 | 0.0176614 | 7/28 |
| GO:0032609 | interferon-gamma production | 3.692530 | 0.0010482 | 0.0132465 | 8/34 |
| GO:0071887 | leukocyte apoptotic process | 3.672889 | 0.0001297 | 0.0026405 | 11/47 |
| GO:0006413 | translational initiation | 3.444860 | 0.0000000 | 0.0000000 | 36/164 |
| GO:0050900 | leukocyte migration | 3.411576 | 0.0000000 | 0.0000033 | 25/115 |
| GO:0043062 | extracellular structure organization | 3.257090 | 0.0004021 | 0.0061409 | 11/53 |
| GO:0046683 | response to organophosphorus | 3.230964 | 0.0048185 | 0.0470299 | 7/34 |
| GO:0070371 | ERK1 and ERK2 cascade | 3.219129 | 0.0000234 | 0.0006850 | 16/78 |
| GO:0030902 | hindbrain development | 3.219129 | 0.0026866 | 0.0293923 | 8/39 |
| GO:0034612 | response to tumor necrosis factor | 3.206148 | 0.0000042 | 0.0002075 | 19/93 |
| GO:0070555 | response to interleukin-1 | 3.138650 | 0.0005628 | 0.0079333 | 11/55 |
| GO:0002576 | platelet degranulation | 3.138650 | 0.0031763 | 0.0337429 | 8/40 |
| GO:0072507 | divalent inorganic cation homeostasis | 3.089223 | 0.0000003 | 0.0000162 | 25/127 |
| GO:0071241 | cellular response to inorganic substance | 3.051466 | 0.0001398 | 0.0026968 | 14/72 |
| GO:0003012 | muscle system process | 3.031651 | 0.0000297 | 0.0008372 | 17/88 |
| GO:0070482 | response to oxygen levels | 3.026556 | 0.0000001 | 0.0000090 | 27/140 |
| GO:0071706 | tumor necrosis factor superfamily cytokine production | 3.017933 | 0.0013731 | 0.0170594 | 10/52 |
| GO:0002285 | lymphocyte activation involved in immune response | 3.009665 | 0.0001632 | 0.0029906 | 14/73 |
| GO:0032103 | positive regulation of response to external stimulus | 2.979731 | 0.0001077 | 0.0022546 | 15/79 |
| GO:0002181 | cytoplasmic translation | 2.968993 | 0.0001899 | 0.0033950 | 14/74 |
| GO:0042110 | T cell activation | 2.947090 | 0.0000000 | 0.0000001 | 40/213 |
| GO:0048872 | homeostasis of number of cells | 2.877096 | 0.0000049 | 0.0002120 | 22/120 |
| GO:0090150 | establishment of protein localization to membrane | 2.832441 | 0.0000000 | 0.0000006 | 37/205 |
| GO:0002449 | lymphocyte mediated immunity | 2.796817 | 0.0000539 | 0.0012739 | 18/101 |
| GO:0045785 | positive regulation of cell adhesion | 2.787617 | 0.0000008 | 0.0000433 | 27/152 |
| GO:0042063 | gliogenesis | 2.756923 | 0.0006793 | 0.0092215 | 13/74 |
| GO:0031099 | regeneration | 2.753202 | 0.0028218 | 0.0304177 | 10/57 |
| GO:0070661 | leukocyte proliferation | 2.710653 | 0.0000524 | 0.0012739 | 19/110 |
| GO:0003013 | circulatory system process | 2.674986 | 0.0003748 | 0.0058445 | 15/88 |
| GO:0019882 | antigen processing and presentation | 2.667853 | 0.0001593 | 0.0029906 | 17/100 |
| GO:0050866 | negative regulation of cell activation | 2.659873 | 0.0036658 | 0.0378452 | 10/59 |
| GO:0002521 | leukocyte differentiation | 2.641438 | 0.0000001 | 0.0000076 | 34/202 |
| GO:0010038 | response to metal ion | 2.638688 | 0.0000768 | 0.0017590 | 19/113 |
| GO:0052547 | regulation of peptidase activity | 2.632416 | 0.0000038 | 0.0001990 | 26/155 |
| GO:0050867 | positive regulation of cell activation | 2.615542 | 0.0000156 | 0.0004778 | 23/138 |
| GO:0042113 | B cell activation | 2.615542 | 0.0001333 | 0.0026405 | 18/108 |
| GO:0022407 | regulation of cell-cell adhesion | 2.598882 | 0.0000049 | 0.0002120 | 26/157 |
| GO:0051346 | negative regulation of hydrolase activity | 2.598221 | 0.0000075 | 0.0002740 | 25/151 |
| GO:0002250 | adaptive immune response | 2.597504 | 0.0000115 | 0.0003745 | 24/145 |
| GO:0002237 | response to molecule of bacterial origin | 2.588578 | 0.0003543 | 0.0056457 | 16/97 |
| GO:0050727 | regulation of inflammatory response | 2.588578 | 0.0003543 | 0.0056457 | 16/97 |
| GO:0006401 | RNA catabolic process | 2.574674 | 0.0000000 | 0.0000008 | 42/256 |
| GO:0055076 | transition metal ion homeostasis | 2.572664 | 0.0046985 | 0.0470299 | 10/61 |
| GO:0051271 | negative regulation of cellular component movement | 2.510920 | 0.0025010 | 0.0277763 | 12/75 |
| GO:0007159 | leukocyte cell-cell adhesion | 2.445702 | 0.0000325 | 0.0008820 | 24/154 |
| GO:0006605 | protein targeting | 2.423668 | 0.0000001 | 0.0000069 | 40/259 |
| GO:0001819 | positive regulation of cytokine production | 2.383785 | 0.0000499 | 0.0012622 | 24/158 |
| GO:0002683 | negative regulation of immune system process | 2.383785 | 0.0000499 | 0.0012622 | 24/158 |
| GO:0045861 | negative regulation of proteolysis | 2.353988 | 0.0005145 | 0.0075424 | 18/120 |
| GO:0072593 | reactive oxygen species metabolic process | 2.353988 | 0.0014881 | 0.0176614 | 15/100 |
| GO:0002694 | regulation of leukocyte activation | 2.350197 | 0.0000052 | 0.0002126 | 31/207 |
| GO:0002791 | regulation of peptide secretion | 2.342276 | 0.0002716 | 0.0046298 | 20/134 |
| GO:0007249 | I-kappaB kinase/NF-kappaB signaling | 2.329467 | 0.0004140 | 0.0061928 | 19/128 |
| GO:0010959 | regulation of metal ion transport | 2.318321 | 0.0034742 | 0.0363793 | 13/88 |
| GO:0002764 | immune response-regulating signaling pathway | 2.273322 | 0.0000105 | 0.0003669 | 31/214 |
| GO:0009636 | response to toxic substance | 2.241893 | 0.0000981 | 0.0021798 | 25/175 |
| GO:0005996 | monosaccharide metabolic process | 2.153976 | 0.0048856 | 0.0470299 | 14/102 |
| GO:0048871 | multicellular organismal homeostasis | 2.153976 | 0.0048856 | 0.0470299 | 14/102 |
| GO:0002697 | regulation of immune effector process | 2.149761 | 0.0008482 | 0.0113036 | 20/146 |
| GO:1903706 | regulation of hemopoiesis | 2.074395 | 0.0005896 | 0.0081550 | 23/174 |
| GO:0030099 | myeloid cell differentiation | 2.030891 | 0.0010327 | 0.0132465 | 22/170 |
| GO:0009615 | response to virus | 2.028379 | 0.0022789 | 0.0261005 | 19/147 |
| GO:0019058 | viral life cycle | 2.028379 | 0.0022789 | 0.0261005 | 19/147 |
| Factor | 1 | 2 | 3 | 4 | 5 | 6 | 7 | 8 | 9 | 10 |
| Signif_GO_terms | 0 | 0 | 0 | 0 | 0 | 2 | 36 | 27 | 81 | 0 |
| Factor | 11 | 12 | 13 | 14 | 15 | 16 | 17 | 18 | 19 | 20 |
| Signif_GO_terms | 31 | 7 | 57 | 20 | 6 | 6 | 106 | 50 | 120 | 75 |
5.1.1 Factors of interest
7: immune response, interleukin production, response to chemokine, cell killing
8: cell killing, leukocyte migration
9: response to chemokine, interleukin production, leukocyte migration, cell killing, T cell activation
11: cell chemotaxis, interleukin production, leukocyte migration, T cell activation
12: DNA conformation change, DNA replication
13: interleukin production, cell killing, cell chemotaxis, leukocyte migration
14: meiotic cell cycle, cytokinesis, chromosome segregation, cell cycle G2/M phase transition
16: (cell killing)
17: cell killing, interleukin production, T cell activation, leukocyte proliferation, cell-cell adhesion, leukocyte migration, adaptive immune response, ……
18: cell chemotaxis, leukocyte migration, signal transduction by p53 class mediator
19: interleukin production, leukocyte migration, leukocyte proliferation, cell killing, B cell activation
20: cell chemotaxis, cell killing, leukocyte migration, leukocyte proliferation, T cell activation
From the reference study:
Targeting CD5, RASA2, SOCS1, and CBLB promoted programs that are characterized by the induction of markers of activation states (e.g. IL2RA, TNFRSF18/GITR), cell cycle genes (e.g. MKI67, UBE2S, CENPF and TOP2A), and effector molecules (e.g GZMB).
Associated factors in GSFA:
CD5: 7, 9
RASA2: 11, 13, 19, 20
SOCS1: 11
CBLB: 7, 9, 11
From the reference study:
Targeting CD3D or LCP2 inhibited the cluster 10 activation program and promoted programs characterized by expression of resting state markers such as IL7R and CCR7.
Associated factors in GSFA
CD3D: 7, 13
LCP2: 2, 4, 7, 13
5.2 Reactome Pathway Over-Representation Analysis
Gene sets: The Reactome pathway database.
| GeneSet | description | enrichmentRatio | pValue | FDR | GeneRatio |
|---|---|---|---|---|---|
| R-HSA-176974 | Unwinding of DNA | 2.253105 | 0.0002922 | 0.0092682 | 10/10 |
| R-HSA-445355 | Smooth Muscle Contraction | 2.127932 | 0.0000101 | 0.0026273 | 17/18 |
| R-HSA-446728 | Cell junction organization | 2.092169 | 0.0002086 | 0.0074105 | 13/14 |
| R-HSA-9008059 | Interleukin-37 signaling | 2.048277 | 0.0019219 | 0.0348290 | 10/11 |
| R-HSA-174411 | Polymerase switching on the C-strand of the telomere | 2.048277 | 0.0019219 | 0.0348290 | 10/11 |
| R-HSA-69091 | Polymerase switching | 2.048277 | 0.0019219 | 0.0348290 | 10/11 |
| R-HSA-69109 | Leading Strand Synthesis | 2.048277 | 0.0019219 | 0.0348290 | 10/11 |
| R-HSA-446353 | Cell-extracellular matrix interactions | 2.048277 | 0.0019219 | 0.0348290 | 10/11 |
| GeneSet | description | enrichmentRatio | pValue | FDR | GeneRatio |
|---|---|---|---|---|---|
| R-HSA-176974 | Unwinding of DNA | 2.106136 | 0.0005747 | 0.0085057 | 10/10 |
| GeneSet | description | enrichmentRatio | pValue | FDR | GeneRatio |
|---|---|---|---|---|---|
| R-HSA-174411 | Polymerase switching on the C-strand of the telomere | 2.230679 | 0.0001444 | 0.0018055 | 11/11 |
| R-HSA-69091 | Polymerase switching | 2.230679 | 0.0001444 | 0.0018055 | 11/11 |
| R-HSA-69109 | Leading Strand Synthesis | 2.230679 | 0.0001444 | 0.0018055 | 11/11 |
| R-HSA-176974 | Unwinding of DNA | 2.230679 | 0.0003231 | 0.0036315 | 10/10 |
| R-HSA-912446 | Meiotic recombination | 2.144884 | 0.0000000 | 0.0000021 | 25/26 |
| R-HSA-69190 | DNA strand elongation | 2.144884 | 0.0000000 | 0.0000021 | 25/26 |
| R-HSA-5693554 | Resolution of D-loop Structures through Synthesis-Dependent Strand Annealing (SDSA) | 2.099463 | 0.0000252 | 0.0004151 | 16/17 |
| R-HSA-69186 | Lagging Strand Synthesis | 2.091262 | 0.0000534 | 0.0007648 | 15/16 |
| R-HSA-5334118 | DNA methylation | 2.044789 | 0.0010230 | 0.0094627 | 11/12 |
| R-HSA-73728 | RNA Polymerase I Promoter Opening | 2.044789 | 0.0010230 | 0.0094627 | 11/12 |
| R-HSA-5625886 | Activated PKN1 stimulates transcription of AR (androgen receptor) regulated genes KLK2 and KLK3 | 2.027890 | 0.0021102 | 0.0169976 | 10/11 |
| R-HSA-5358508 | Mismatch Repair | 2.027890 | 0.0021102 | 0.0169976 | 10/11 |
| R-HSA-69183 | Processive synthesis on the lagging strand | 2.027890 | 0.0021102 | 0.0169976 | 10/11 |
| R-HSA-2299718 | Condensation of Prophase Chromosomes | 2.018234 | 0.0000159 | 0.0002996 | 19/21 |
| R-HSA-5693579 | Homologous DNA Pairing and Strand Exchange | 2.007611 | 0.0000003 | 0.0000117 | 27/30 |
| R-HSA-5696397 | Gap-filling DNA repair synthesis and ligation in GG-NER | 2.007611 | 0.0000323 | 0.0005014 | 18/20 |
| R-HSA-156711 | Polo-like kinase mediated events | 2.007611 | 0.0043201 | 0.0297384 | 9/10 |
| R-HSA-5358565 | Mismatch repair (MMR) directed by MSH2:MSH6 (MutSalpha) | 2.007611 | 0.0043201 | 0.0297384 | 9/10 |
| R-HSA-5358606 | Mismatch repair (MMR) directed by MSH2:MSH3 (MutSbeta) | 2.007611 | 0.0043201 | 0.0297384 | 9/10 |
| R-HSA-69166 | Removal of the Flap Intermediate | 2.007611 | 0.0043201 | 0.0297384 | 9/10 |
| R-HSA-75035 | Chk1/Chk2(Cds1) mediated inactivation of Cyclin B:Cdk1 complex | 2.007611 | 0.0043201 | 0.0297384 | 9/10 |
| GeneSet | description | enrichmentRatio | pValue | FDR | GeneRatio |
|---|---|---|---|---|---|
| R-HSA-373076 | Class A/1 (Rhodopsin-like receptors) | 2.777444 | 0.0000019 | 0.0000631 | 17/22 |
| R-HSA-375276 | Peptide ligand-binding receptors | 2.695755 | 0.0009114 | 0.0149873 | 9/12 |
| R-HSA-389948 | PD-1 signaling | 2.635849 | 0.0003177 | 0.0065598 | 11/15 |
| R-HSA-446353 | Cell-extracellular matrix interactions | 2.614065 | 0.0025008 | 0.0341653 | 8/11 |
| R-HSA-446728 | Cell junction organization | 2.567385 | 0.0008525 | 0.0142826 | 10/14 |
| R-HSA-216083 | Integrin cell surface interactions | 2.567385 | 0.0008525 | 0.0142826 | 10/14 |
| R-HSA-622312 | Inflammasomes | 2.488389 | 0.0022322 | 0.0309713 | 9/13 |
| R-HSA-500792 | GPCR ligand binding | 2.471109 | 0.0000016 | 0.0000563 | 22/32 |
| R-HSA-202427 | Phosphorylation of CD3 and TCR zeta chains | 2.471109 | 0.0007616 | 0.0135253 | 11/16 |
| R-HSA-198933 | Immunoregulatory interactions between a Lymphoid and a non-Lymphoid cell | 2.396226 | 0.0000012 | 0.0000481 | 24/36 |
| R-HSA-2172127 | DAP12 interactions | 2.396226 | 0.0019221 | 0.0279801 | 10/15 |
| R-HSA-2424491 | DAP12 signaling | 2.396226 | 0.0019221 | 0.0279801 | 10/15 |
| R-HSA-1474228 | Degradation of the extracellular matrix | 2.325749 | 0.0016180 | 0.0243525 | 11/17 |
| R-HSA-163210 | Formation of ATP by chemiosmotic coupling | 2.325749 | 0.0016180 | 0.0243525 | 11/17 |
| R-HSA-1500931 | Cell-Cell communication | 2.318929 | 0.0000207 | 0.0005264 | 20/31 |
| R-HSA-156842 | Eukaryotic Translation Elongation | 2.313598 | 0.0000000 | 0.0000000 | 56/87 |
| R-HSA-6785807 | Interleukin-4 and Interleukin-13 signaling | 2.296384 | 0.0000062 | 0.0001839 | 23/36 |
| R-HSA-156902 | Peptide chain elongation | 2.283463 | 0.0000000 | 0.0000000 | 54/85 |
| R-HSA-192823 | Viral mRNA Translation | 2.283463 | 0.0000000 | 0.0000000 | 54/85 |
| R-HSA-202733 | Cell surface interactions at the vascular wall | 2.279337 | 0.0000019 | 0.0000631 | 26/41 |
| R-HSA-202433 | Generation of second messenger molecules | 2.246462 | 0.0003895 | 0.0078613 | 15/24 |
| R-HSA-2408557 | Selenocysteine synthesis | 2.198890 | 0.0000000 | 0.0000000 | 52/85 |
| R-HSA-977225 | Amyloid fiber formation | 2.156604 | 0.0007255 | 0.0131472 | 15/25 |
| R-HSA-1474244 | Extracellular matrix organization | 2.137175 | 0.0000510 | 0.0011602 | 22/37 |
| R-HSA-72689 | Formation of a pool of free 40S subunits | 2.134139 | 0.0000000 | 0.0000000 | 57/96 |
| R-HSA-72764 | Eukaryotic Translation Termination | 2.123928 | 0.0000000 | 0.0000000 | 52/88 |
| R-HSA-975956 | Nonsense Mediated Decay (NMD) independent of the Exon Junction Complex (EJC) | 2.116667 | 0.0000000 | 0.0000000 | 53/90 |
| R-HSA-72695 | Formation of the ternary complex, and subsequently, the 43S complex | 2.096698 | 0.0000080 | 0.0002159 | 28/48 |
| R-HSA-156827 | L13a-mediated translational silencing of Ceruloplasmin expression | 2.068441 | 0.0000000 | 0.0000000 | 61/106 |
| R-HSA-5357905 | Regulation of TNFR1 signaling | 2.031583 | 0.0034617 | 0.0452057 | 13/23 |
| R-HSA-168643 | Nucleotide-binding domain, leucine rich repeat containing receptor (NLR) signaling pathways | 2.021816 | 0.0006389 | 0.0120710 | 18/32 |
| R-HSA-72706 | GTP hydrolysis and joining of the 60S ribosomal subunit | 2.015518 | 0.0000000 | 0.0000000 | 60/107 |
| R-HSA-1799339 | SRP-dependent cotranslational protein targeting to membrane | 2.015518 | 0.0000000 | 0.0000000 | 60/107 |
| R-HSA-416476 | G alpha (q) signalling events | 2.006143 | 0.0000960 | 0.0020803 | 24/43 |
| GeneSet | description | enrichmentRatio | pValue | FDR | GeneRatio |
|---|---|---|---|---|---|
| R-HSA-156842 | Eukaryotic Translation Elongation | 5.137738 | 0.0000000 | 0.0000000 | 84/87 |
| R-HSA-156902 | Peptide chain elongation | 5.133421 | 0.0000000 | 0.0000000 | 82/85 |
| R-HSA-192823 | Viral mRNA Translation | 5.008216 | 0.0000000 | 0.0000000 | 80/85 |
| R-HSA-2408557 | Selenocysteine synthesis | 5.008216 | 0.0000000 | 0.0000000 | 80/85 |
| R-HSA-72689 | Formation of a pool of free 40S subunits | 4.933223 | 0.0000000 | 0.0000000 | 89/96 |
| R-HSA-72764 | Eukaryotic Translation Termination | 4.837481 | 0.0000000 | 0.0000000 | 80/88 |
| R-HSA-975956 | Nonsense Mediated Decay (NMD) independent of the Exon Junction Complex (EJC) | 4.789106 | 0.0000000 | 0.0000000 | 81/90 |
| R-HSA-72695 | Formation of the ternary complex, and subsequently, the 43S complex | 4.656075 | 0.0000000 | 0.0000000 | 42/48 |
| R-HSA-156827 | L13a-mediated translational silencing of Ceruloplasmin expression | 4.618425 | 0.0000000 | 0.0000000 | 92/106 |
| R-HSA-389948 | PD-1 signaling | 4.611732 | 0.0000000 | 0.0000006 | 13/15 |
| R-HSA-72706 | GTP hydrolysis and joining of the 60S ribosomal subunit | 4.525531 | 0.0000000 | 0.0000000 | 91/107 |
| R-HSA-2408522 | Selenoamino acid metabolism | 4.461232 | 0.0000000 | 0.0000000 | 83/99 |
| R-HSA-1799339 | SRP-dependent cotranslational protein targeting to membrane | 4.426069 | 0.0000000 | 0.0000000 | 89/107 |
| R-HSA-72613 | Eukaryotic Translation Initiation | 4.341003 | 0.0000000 | 0.0000000 | 93/114 |
| R-HSA-72737 | Cap-dependent Translation Initiation | 4.341003 | 0.0000000 | 0.0000000 | 93/114 |
| R-HSA-202427 | Phosphorylation of CD3 and TCR zeta chains | 4.323499 | 0.0000001 | 0.0000027 | 13/16 |
| R-HSA-72662 | Activation of the mRNA upon binding of the cap-binding complex and eIFs, and subsequent binding to 43S | 4.275988 | 0.0000000 | 0.0000000 | 45/56 |
| R-HSA-72649 | Translation initiation complex formation | 4.256983 | 0.0000000 | 0.0000000 | 44/55 |
| R-HSA-202430 | Translocation of ZAP-70 to Immunological synapse | 4.180966 | 0.0000020 | 0.0000460 | 11/14 |
| R-HSA-72702 | Ribosomal scanning and start codon recognition | 4.160234 | 0.0000000 | 0.0000000 | 43/55 |
| R-HSA-927802 | Nonsense-Mediated Decay (NMD) | 4.089463 | 0.0000000 | 0.0000000 | 83/108 |
| R-HSA-975957 | Nonsense Mediated Decay (NMD) enhanced by the Exon Junction Complex (EJC) | 4.089463 | 0.0000000 | 0.0000000 | 83/108 |
| R-HSA-168273 | Influenza Viral RNA Transcription and Replication | 3.707414 | 0.0000000 | 0.0000000 | 85/122 |
| R-HSA-198933 | Immunoregulatory interactions between a Lymphoid and a non-Lymphoid cell | 3.547486 | 0.0000000 | 0.0000000 | 24/36 |
| R-HSA-168255 | Influenza Life Cycle | 3.533946 | 0.0000000 | 0.0000000 | 87/131 |
| R-HSA-3928662 | EPHB-mediated forward signaling | 3.458799 | 0.0000069 | 0.0001465 | 13/20 |
| R-HSA-9010553 | Regulation of expression of SLITs and ROBOs | 3.415654 | 0.0000000 | 0.0000000 | 95/148 |
| R-HSA-168254 | Influenza Infection | 3.382781 | 0.0000000 | 0.0000000 | 89/140 |
| R-HSA-983170 | Antigen Presentation: Folding, assembly and peptide loading of class I MHC | 3.192737 | 0.0000508 | 0.0009811 | 12/20 |
| R-HSA-376176 | Signaling by ROBO receptors | 3.167398 | 0.0000000 | 0.0000000 | 100/168 |
| R-HSA-427359 | SIRT1 negatively regulates rRNA expression | 3.104050 | 0.0026428 | 0.0340121 | 7/12 |
| R-HSA-5627117 | RHO GTPases Activate ROCKs | 3.104050 | 0.0026428 | 0.0340121 | 7/12 |
| R-HSA-445355 | Smooth Muscle Contraction | 2.956238 | 0.0005245 | 0.0081709 | 10/18 |
| R-HSA-6791226 | Major pathway of rRNA processing in the nucleolus and cytosol | 2.844682 | 0.0000000 | 0.0000000 | 85/159 |
| R-HSA-2682334 | EPH-Ephrin signaling | 2.800647 | 0.0000026 | 0.0000574 | 20/38 |
| R-HSA-5663213 | RHO GTPases Activate WASPs and WAVEs | 2.767039 | 0.0001826 | 0.0031182 | 13/25 |
| R-HSA-8868773 | rRNA processing in the nucleus and cytosol | 2.707844 | 0.0000000 | 0.0000000 | 86/169 |
| R-HSA-422475 | Axon guidance | 2.660614 | 0.0000000 | 0.0000000 | 130/260 |
| R-HSA-877300 | Interferon gamma signaling | 2.660614 | 0.0000015 | 0.0000345 | 23/46 |
| R-HSA-202433 | Generation of second messenger molecules | 2.660614 | 0.0005196 | 0.0081709 | 12/24 |
| R-HSA-72312 | rRNA processing | 2.600146 | 0.0000000 | 0.0000000 | 86/176 |
| R-HSA-71291 | Metabolism of amino acids and derivatives | 2.586018 | 0.0000000 | 0.0000000 | 104/214 |
| R-HSA-5625740 | RHO GTPases activate PKNs | 2.568869 | 0.0002842 | 0.0046727 | 14/29 |
| R-HSA-388841 | Costimulation by the CD28 family | 2.465935 | 0.0000482 | 0.0009505 | 19/41 |
| R-HSA-8950505 | Gene and protein expression by JAK-STAT signaling after Interleukin-12 stimulation | 2.403136 | 0.0006689 | 0.0100671 | 14/31 |
| R-HSA-72766 | Translation | 2.400555 | 0.0000000 | 0.0000000 | 120/266 |
| R-HSA-977225 | Amyloid fiber formation | 2.341341 | 0.0032587 | 0.0407567 | 11/25 |
| R-HSA-202733 | Cell surface interactions at the vascular wall | 2.336149 | 0.0001808 | 0.0031182 | 18/41 |
| R-HSA-9020591 | Interleukin-12 signaling | 2.280527 | 0.0008507 | 0.0121835 | 15/35 |
| R-HSA-447115 | Interleukin-12 family signaling | 2.261522 | 0.0004367 | 0.0070503 | 17/40 |
| R-HSA-2029482 | Regulation of actin dynamics for phagocytic cup formation | 2.240518 | 0.0007273 | 0.0107638 | 16/38 |
| R-HSA-1236975 | Antigen processing-Cross presentation | 2.217179 | 0.0000050 | 0.0001075 | 30/72 |
| R-HSA-5663205 | Infectious disease | 2.194143 | 0.0000000 | 0.0000000 | 127/308 |
| R-HSA-1266738 | Developmental Biology | 2.170110 | 0.0000000 | 0.0000000 | 146/358 |
| R-HSA-1236974 | ER-Phagosome pathway | 2.112841 | 0.0000419 | 0.0008570 | 27/68 |
| R-HSA-114608 | Platelet degranulation | 2.106320 | 0.0006024 | 0.0092225 | 19/48 |
| R-HSA-5668541 | TNFR2 non-canonical NF-kB pathway | 2.015617 | 0.0001970 | 0.0033010 | 25/66 |
| R-HSA-2029480 | Fcgamma receptor (FCGR) dependent phagocytosis | 2.010242 | 0.0021204 | 0.0281038 | 17/45 |
| GeneSet | description | enrichmentRatio | pValue | FDR | GeneRatio |
|---|---|---|---|---|---|
| R-HSA-202430 | Translocation of ZAP-70 to Immunological synapse | 5.056709 | 0.0000003 | 0.0000303 | 11/14 |
| R-HSA-198933 | Immunoregulatory interactions between a Lymphoid and a non-Lymphoid cell | 5.005631 | 0.0000000 | 0.0000000 | 28/36 |
| R-HSA-202427 | Phosphorylation of CD3 and TCR zeta chains | 4.826858 | 0.0000002 | 0.0000290 | 12/16 |
| R-HSA-389948 | PD-1 signaling | 4.719595 | 0.0000009 | 0.0000781 | 11/15 |
| R-HSA-6783783 | Interleukin-10 signaling | 4.505068 | 0.0001652 | 0.0035779 | 7/10 |
| R-HSA-202433 | Generation of second messenger molecules | 4.290540 | 0.0000000 | 0.0000062 | 16/24 |
| R-HSA-2142753 | Arachidonic acid metabolism | 4.095516 | 0.0003936 | 0.0075976 | 7/11 |
| R-HSA-373076 | Class A/1 (Rhodopsin-like receptors) | 3.802979 | 0.0000035 | 0.0001594 | 13/22 |
| R-HSA-375276 | Peptide ligand-binding receptors | 3.754223 | 0.0008186 | 0.0145387 | 7/12 |
| R-HSA-216083 | Integrin cell surface interactions | 3.677606 | 0.0004080 | 0.0077080 | 8/14 |
| R-HSA-912526 | Interleukin receptor SHC signaling | 3.510442 | 0.0031492 | 0.0473975 | 6/11 |
| R-HSA-451927 | Interleukin-2 family signaling | 3.371139 | 0.0000924 | 0.0023439 | 11/21 |
| R-HSA-2219530 | Constitutive Signaling by Aberrant PI3K in Cancer | 3.217905 | 0.0026676 | 0.0408420 | 7/14 |
| R-HSA-877300 | Interferon gamma signaling | 3.077996 | 0.0000002 | 0.0000290 | 22/46 |
| R-HSA-983695 | Antigen activates B Cell Receptor (BCR) leading to generation of second messengers | 3.064672 | 0.0005269 | 0.0097480 | 10/21 |
| R-HSA-500792 | GPCR ligand binding | 3.016786 | 0.0000267 | 0.0009893 | 15/32 |
| R-HSA-202733 | Cell surface interactions at the vascular wall | 2.982449 | 0.0000028 | 0.0001531 | 19/41 |
| R-HSA-212300 | PRC2 methylates histones and DNA | 2.896115 | 0.0016652 | 0.0273826 | 9/20 |
| R-HSA-445355 | Smooth Muscle Contraction | 2.860360 | 0.0033348 | 0.0485454 | 8/18 |
| R-HSA-1500931 | Cell-Cell communication | 2.698888 | 0.0003698 | 0.0074634 | 13/31 |
| R-HSA-6785807 | Interleukin-4 and Interleukin-13 signaling | 2.681588 | 0.0001432 | 0.0031787 | 15/36 |
| R-HSA-388841 | Costimulation by the CD28 family | 2.668507 | 0.0000557 | 0.0015444 | 17/41 |
| R-HSA-1474244 | Extracellular matrix organization | 2.609113 | 0.0002069 | 0.0043740 | 15/37 |
| R-HSA-72695 | Formation of the ternary complex, and subsequently, the 43S complex | 2.547508 | 0.0000443 | 0.0013565 | 19/48 |
| R-HSA-72649 | Translation initiation complex formation | 2.457310 | 0.0000336 | 0.0011922 | 21/55 |
| R-HSA-373760 | L1CAM interactions | 2.451738 | 0.0003004 | 0.0062030 | 16/42 |
| R-HSA-156842 | Eukaryotic Translation Elongation | 2.441170 | 0.0000002 | 0.0000290 | 33/87 |
| R-HSA-72662 | Activation of the mRNA upon binding of the cap-binding complex and eIFs, and subsequent binding to 43S | 2.413429 | 0.0000460 | 0.0013625 | 21/56 |
| R-HSA-909733 | Interferon alpha/beta signaling | 2.413429 | 0.0020013 | 0.0317344 | 12/32 |
| R-HSA-156902 | Peptide chain elongation | 2.347178 | 0.0000015 | 0.0000925 | 31/85 |
| R-HSA-192823 | Viral mRNA Translation | 2.347178 | 0.0000015 | 0.0000925 | 31/85 |
| R-HSA-2408557 | Selenocysteine synthesis | 2.347178 | 0.0000015 | 0.0000925 | 31/85 |
| R-HSA-72702 | Ribosomal scanning and start codon recognition | 2.340295 | 0.0001154 | 0.0028466 | 20/55 |
| R-HSA-975956 | Nonsense Mediated Decay (NMD) independent of the Exon Junction Complex (EJC) | 2.288288 | 0.0000019 | 0.0001115 | 32/90 |
| R-HSA-72764 | Eukaryotic Translation Termination | 2.267161 | 0.0000034 | 0.0001594 | 31/88 |
| R-HSA-447115 | Interleukin-12 family signaling | 2.252534 | 0.0018710 | 0.0302090 | 14/40 |
| R-HSA-76005 | Response to elevated platelet cytosolic Ca2+ | 2.104015 | 0.0015059 | 0.0252310 | 17/52 |
| R-HSA-72689 | Formation of a pool of free 40S subunits | 2.078231 | 0.0000260 | 0.0009893 | 31/96 |
| R-HSA-156827 | L13a-mediated translational silencing of Ceruloplasmin expression | 2.064317 | 0.0000124 | 0.0005249 | 34/106 |
| R-HSA-2408522 | Selenoamino acid metabolism | 2.015254 | 0.0000510 | 0.0014610 | 31/99 |
| GeneSet | description | enrichmentRatio | pValue | FDR | GeneRatio |
|---|---|---|---|---|---|
| R-HSA-8864260 | Transcriptional regulation by the AP-2 (TFAP2) family of transcription factors | 2.004304 | 0.0041693 | 0.0402428 | 11/15 |
| R-HSA-5627123 | RHO GTPases activate PAKs | 2.004304 | 0.0041693 | 0.0402428 | 11/15 |
| GeneSet | description | enrichmentRatio | pValue | FDR | GeneRatio |
|---|---|---|---|---|---|
| R-HSA-445355 | Smooth Muscle Contraction | 3.605028 | 0.0000005 | 0.0000695 | 14/18 |
| R-HSA-6783783 | Interleukin-10 signaling | 3.244525 | 0.0013758 | 0.0219961 | 7/10 |
| R-HSA-5627123 | RHO GTPases activate PAKs | 3.090024 | 0.0002144 | 0.0050099 | 10/15 |
| R-HSA-389948 | PD-1 signaling | 3.090024 | 0.0002144 | 0.0050099 | 10/15 |
| R-HSA-202430 | Translocation of ZAP-70 to Immunological synapse | 2.979666 | 0.0006762 | 0.0133430 | 9/14 |
| R-HSA-912526 | Interleukin receptor SHC signaling | 2.949569 | 0.0030817 | 0.0437308 | 7/11 |
| R-HSA-202427 | Phosphorylation of CD3 and TCR zeta chains | 2.896898 | 0.0004617 | 0.0102498 | 10/16 |
| R-HSA-622312 | Inflammasomes | 2.852330 | 0.0020605 | 0.0310128 | 8/13 |
| R-HSA-2871809 | FCERI mediated Ca+2 mobilization | 2.726492 | 0.0009060 | 0.0167613 | 10/17 |
| R-HSA-202433 | Generation of second messenger molecules | 2.703771 | 0.0000939 | 0.0030735 | 14/24 |
| R-HSA-5626467 | RHO GTPases activate IQGAPs | 2.607208 | 0.0025352 | 0.0375203 | 9/16 |
| R-HSA-5663213 | RHO GTPases Activate WASPs and WAVEs | 2.595620 | 0.0001714 | 0.0043489 | 14/25 |
| R-HSA-198933 | Immunoregulatory interactions between a Lymphoid and a non-Lymphoid cell | 2.575020 | 0.0000080 | 0.0005090 | 20/36 |
| R-HSA-3928662 | EPHB-mediated forward signaling | 2.549270 | 0.0010730 | 0.0186814 | 11/20 |
| R-HSA-191273 | Cholesterol biosynthesis | 2.549270 | 0.0010730 | 0.0186814 | 11/20 |
| R-HSA-983695 | Antigen activates B Cell Receptor (BCR) leading to generation of second messengers | 2.427876 | 0.0018192 | 0.0278521 | 11/21 |
| R-HSA-114608 | Platelet degranulation | 2.414081 | 0.0000029 | 0.0002554 | 25/48 |
| R-HSA-76005 | Response to elevated platelet cytosolic Ca2+ | 2.406654 | 0.0000012 | 0.0001224 | 27/52 |
| R-HSA-6785807 | Interleukin-4 and Interleukin-13 signaling | 2.317518 | 0.0001450 | 0.0039011 | 18/36 |
| R-HSA-397014 | Muscle contraction | 2.260993 | 0.0000969 | 0.0030735 | 20/41 |
| R-HSA-388841 | Costimulation by the CD28 family | 2.147944 | 0.0003372 | 0.0076774 | 19/41 |
| R-HSA-76002 | Platelet activation, signaling and aggregation | 2.139248 | 0.0000000 | 0.0000055 | 48/104 |
| R-HSA-156842 | Eukaryotic Translation Elongation | 2.131051 | 0.0000003 | 0.0000450 | 40/87 |
| R-HSA-1474244 | Extracellular matrix organization | 2.129611 | 0.0007807 | 0.0150715 | 17/37 |
| R-HSA-156902 | Peptide chain elongation | 2.126664 | 0.0000004 | 0.0000569 | 39/85 |
| R-HSA-1655829 | Regulation of cholesterol biosynthesis by SREBP (SREBF) | 2.093242 | 0.0027598 | 0.0401758 | 14/31 |
| R-HSA-2029482 | Regulation of actin dynamics for phagocytic cup formation | 2.073569 | 0.0011338 | 0.0189971 | 17/38 |
| R-HSA-202733 | Cell surface interactions at the vascular wall | 2.034894 | 0.0010694 | 0.0186814 | 18/41 |
| R-HSA-8957322 | Metabolism of steroids | 2.032911 | 0.0001222 | 0.0033914 | 25/57 |
| R-HSA-192823 | Viral mRNA Translation | 2.017604 | 0.0000037 | 0.0002741 | 37/85 |
| R-HSA-2408557 | Selenocysteine synthesis | 2.017604 | 0.0000037 | 0.0002741 | 37/85 |
| R-HSA-877300 | Interferon gamma signaling | 2.015233 | 0.0006650 | 0.0133430 | 20/46 |
| R-HSA-418594 | G alpha (i) signalling events | 2.008516 | 0.0001146 | 0.0032833 | 26/60 |
| GeneSet | description | enrichmentRatio | pValue | FDR | GeneRatio |
|---|---|---|---|---|---|
| R-HSA-176974 | Unwinding of DNA | 3.759868 | 0.0000197 | 0.0009126 | 9/10 |
| R-HSA-73728 | RNA Polymerase I Promoter Opening | 3.481360 | 0.0000242 | 0.0009126 | 10/12 |
| R-HSA-5625886 | Activated PKN1 stimulates transcription of AR (androgen receptor) regulated genes KLK2 and KLK3 | 3.418062 | 0.0000852 | 0.0027712 | 9/11 |
| R-HSA-2514853 | Condensation of Prometaphase Chromosomes | 3.342105 | 0.0002949 | 0.0068922 | 8/10 |
| R-HSA-202430 | Translocation of ZAP-70 to Immunological synapse | 3.282425 | 0.0000247 | 0.0009126 | 11/14 |
| R-HSA-2299718 | Condensation of Prophase Chromosomes | 3.182957 | 0.0000006 | 0.0000601 | 16/21 |
| R-HSA-5626467 | RHO GTPases activate IQGAPs | 3.133224 | 0.0000228 | 0.0009126 | 12/16 |
| R-HSA-157858 | Gap junction trafficking and regulation | 3.133224 | 0.0002682 | 0.0064366 | 9/12 |
| R-HSA-190828 | Gap junction trafficking | 3.133224 | 0.0002682 | 0.0064366 | 9/12 |
| R-HSA-5334118 | DNA methylation | 3.133224 | 0.0002682 | 0.0064366 | 9/12 |
| R-HSA-156711 | Polo-like kinase mediated events | 2.924342 | 0.0026438 | 0.0454320 | 7/10 |
| R-HSA-983189 | Kinesins | 2.906179 | 0.0000045 | 0.0002636 | 16/23 |
| R-HSA-389948 | PD-1 signaling | 2.785088 | 0.0005329 | 0.0112662 | 10/15 |
| R-HSA-171306 | Packaging Of Telomere Ends | 2.785088 | 0.0020266 | 0.0359923 | 8/12 |
| R-HSA-427359 | SIRT1 negatively regulates rRNA expression | 2.785088 | 0.0020266 | 0.0359923 | 8/12 |
| R-HSA-212300 | PRC2 methylates histones and DNA | 2.715460 | 0.0001090 | 0.0033378 | 13/20 |
| R-HSA-68962 | Activation of the pre-replicative complex | 2.673684 | 0.0000225 | 0.0009126 | 16/25 |
| R-HSA-606279 | Deposition of new CENPA-containing nucleosomes at the centromere | 2.658493 | 0.0000013 | 0.0000885 | 21/33 |
| R-HSA-774815 | Nucleosome assembly | 2.658493 | 0.0000013 | 0.0000885 | 21/33 |
| R-HSA-202427 | Phosphorylation of CD3 and TCR zeta chains | 2.611020 | 0.0011178 | 0.0215777 | 10/16 |
| R-HSA-912446 | Meiotic recombination | 2.570850 | 0.0000457 | 0.0015593 | 16/26 |
| R-HSA-176187 | Activation of ATR in response to replication stress | 2.475633 | 0.0000874 | 0.0027712 | 16/27 |
| R-HSA-201722 | Formation of the beta-catenin:TCF transactivating complex | 2.410172 | 0.0002217 | 0.0059647 | 15/26 |
| R-HSA-3214858 | RMTs methylate histone arginines | 2.290959 | 0.0001966 | 0.0054567 | 17/31 |
| R-HSA-202433 | Generation of second messenger molecules | 2.262884 | 0.0013178 | 0.0248979 | 13/24 |
| R-HSA-1221632 | Meiotic synapsis | 2.249494 | 0.0009290 | 0.0183317 | 14/26 |
| R-HSA-69190 | DNA strand elongation | 2.249494 | 0.0009290 | 0.0183317 | 14/26 |
| R-HSA-5250924 | B-WICH complex positively regulates rRNA expression | 2.228070 | 0.0004629 | 0.0102758 | 16/30 |
| R-HSA-2500257 | Resolution of Sister Chromatid Cohesion | 2.201118 | 0.0000000 | 0.0000004 | 49/93 |
| R-HSA-2559586 | DNA Damage/Telomere Stress Induced Senescence | 2.152113 | 0.0005262 | 0.0112662 | 17/33 |
| R-HSA-1500620 | Meiosis | 2.088816 | 0.0001437 | 0.0041174 | 22/44 |
| R-HSA-5663220 | RHO GTPases Activate Formins | 2.088816 | 0.0000000 | 0.0000045 | 47/94 |
| R-HSA-141424 | Amplification of signal from the kinetochores | 2.060965 | 0.0000012 | 0.0000885 | 37/75 |
| R-HSA-141444 | Amplification of signal from unattached kinetochores via a MAD2 inhibitory signal | 2.060965 | 0.0000012 | 0.0000885 | 37/75 |
| R-HSA-3371497 | HSP90 chaperone cycle for steroid hormone receptors (SHR) | 2.025518 | 0.0017694 | 0.0327333 | 16/33 |
| R-HSA-73886 | Chromosome Maintenance | 2.019189 | 0.0000293 | 0.0010394 | 29/60 |
| GeneSet | description | enrichmentRatio | pValue | FDR | GeneRatio |
|---|---|---|---|---|---|
| R-HSA-198933 | Immunoregulatory interactions between a Lymphoid and a non-Lymphoid cell | 4.464844 | 0.0000000 | 0.0000000 | 27/36 |
| R-HSA-216083 | Integrin cell surface interactions | 4.252232 | 0.0000088 | 0.0006017 | 10/14 |
| R-HSA-445355 | Smooth Muscle Contraction | 3.968750 | 0.0000032 | 0.0003160 | 12/18 |
| R-HSA-446353 | Cell-extracellular matrix interactions | 3.788352 | 0.0006473 | 0.0180193 | 7/11 |
| R-HSA-912526 | Interleukin receptor SHC signaling | 3.788352 | 0.0006473 | 0.0180193 | 7/11 |
| R-HSA-1236382 | Constitutive Signaling by Ligand-Responsive EGFR Cancer Variants | 3.663461 | 0.0003549 | 0.0121197 | 8/13 |
| R-HSA-1643713 | Signaling by EGFR in Cancer | 3.663461 | 0.0003549 | 0.0121197 | 8/13 |
| R-HSA-5637815 | Signaling by Ligand-Responsive EGFR Variants in Cancer | 3.663461 | 0.0003549 | 0.0121197 | 8/13 |
| R-HSA-2172127 | DAP12 interactions | 3.571875 | 0.0001934 | 0.0074665 | 9/15 |
| R-HSA-2424491 | DAP12 signaling | 3.571875 | 0.0001934 | 0.0074665 | 9/15 |
| R-HSA-909733 | Interferon alpha/beta signaling | 3.534668 | 0.0000001 | 0.0000131 | 19/32 |
| R-HSA-73728 | RNA Polymerase I Promoter Opening | 3.472656 | 0.0013295 | 0.0310692 | 7/12 |
| R-HSA-5218921 | VEGFR2 mediated cell proliferation | 3.472656 | 0.0013295 | 0.0310692 | 7/12 |
| R-HSA-451927 | Interleukin-2 family signaling | 3.401786 | 0.0000308 | 0.0016103 | 12/21 |
| R-HSA-202430 | Translocation of ZAP-70 to Immunological synapse | 3.401786 | 0.0007069 | 0.0190225 | 8/14 |
| R-HSA-977225 | Amyloid fiber formation | 3.333750 | 0.0000090 | 0.0006017 | 14/25 |
| R-HSA-6785807 | Interleukin-4 and Interleukin-13 signaling | 3.307292 | 0.0000001 | 0.0000216 | 20/36 |
| R-HSA-5627123 | RHO GTPases activate PAKs | 3.175000 | 0.0012938 | 0.0310692 | 8/15 |
| R-HSA-389948 | PD-1 signaling | 3.175000 | 0.0012938 | 0.0310692 | 8/15 |
| R-HSA-202733 | Cell surface interactions at the vascular wall | 3.049162 | 0.0000004 | 0.0000550 | 21/41 |
| R-HSA-983170 | Antigen Presentation: Folding, assembly and peptide loading of class I MHC | 2.976562 | 0.0006149 | 0.0180193 | 10/20 |
| R-HSA-212300 | PRC2 methylates histones and DNA | 2.976562 | 0.0006149 | 0.0180193 | 10/20 |
| R-HSA-202427 | Phosphorylation of CD3 and TCR zeta chains | 2.976562 | 0.0022110 | 0.0478864 | 8/16 |
| R-HSA-397014 | Muscle contraction | 2.758765 | 0.0000091 | 0.0006017 | 19/41 |
| R-HSA-202433 | Generation of second messenger molecules | 2.728516 | 0.0008343 | 0.0217906 | 11/24 |
| R-HSA-877300 | Interferon gamma signaling | 2.717731 | 0.0000041 | 0.0003665 | 21/46 |
| R-HSA-1474244 | Extracellular matrix organization | 2.574324 | 0.0001317 | 0.0055693 | 16/37 |
| R-HSA-201722 | Formation of the beta-catenin:TCF transactivating complex | 2.518630 | 0.0018690 | 0.0414926 | 11/26 |
| R-HSA-114608 | Platelet degranulation | 2.480469 | 0.0000370 | 0.0018240 | 20/48 |
| R-HSA-5625740 | RHO GTPases activate PKNs | 2.463362 | 0.0014729 | 0.0335377 | 12/29 |
| R-HSA-76005 | Response to elevated platelet cytosolic Ca2+ | 2.404147 | 0.0000416 | 0.0019420 | 21/52 |
| R-HSA-76002 | Platelet activation, signaling and aggregation | 2.175180 | 0.0000007 | 0.0000897 | 38/104 |
| R-HSA-372790 | Signaling by GPCR | 2.000640 | 0.0000032 | 0.0003160 | 41/122 |
| GeneSet | description | enrichmentRatio | pValue | FDR | GeneRatio |
|---|---|---|---|---|---|
| R-HSA-191273 | Cholesterol biosynthesis | 5.255172 | 0.0000000 | 0.0000000 | 16/20 |
| R-HSA-5625886 | Activated PKN1 stimulates transcription of AR (androgen receptor) regulated genes KLK2 and KLK3 | 4.777430 | 0.0000297 | 0.0009693 | 8/11 |
| R-HSA-2514853 | Condensation of Prometaphase Chromosomes | 4.598276 | 0.0001444 | 0.0034655 | 7/10 |
| R-HSA-2299718 | Condensation of Prophase Chromosomes | 4.379310 | 0.0000001 | 0.0000063 | 14/21 |
| R-HSA-427359 | SIRT1 negatively regulates rRNA expression | 4.379310 | 0.0000773 | 0.0019607 | 8/12 |
| R-HSA-5334118 | DNA methylation | 4.379310 | 0.0000773 | 0.0019607 | 8/12 |
| R-HSA-73728 | RNA Polymerase I Promoter Opening | 4.379310 | 0.0000773 | 0.0019607 | 8/12 |
| R-HSA-389977 | Post-chaperonin tubulin folding pathway | 3.941379 | 0.0014730 | 0.0198190 | 6/10 |
| R-HSA-156711 | Polo-like kinase mediated events | 3.941379 | 0.0014730 | 0.0198190 | 6/10 |
| R-HSA-171306 | Packaging Of Telomere Ends | 3.831897 | 0.0007200 | 0.0133204 | 7/12 |
| R-HSA-983189 | Kinesins | 3.712894 | 0.0000054 | 0.0002096 | 13/23 |
| R-HSA-912446 | Meiotic recombination | 3.284483 | 0.0000317 | 0.0009693 | 13/26 |
| R-HSA-1221632 | Meiotic synapsis | 3.284483 | 0.0000317 | 0.0009693 | 13/26 |
| R-HSA-606279 | Deposition of new CENPA-containing nucleosomes at the centromere | 3.184953 | 0.0000063 | 0.0002246 | 16/33 |
| R-HSA-774815 | Nucleosome assembly | 3.184953 | 0.0000063 | 0.0002246 | 16/33 |
| R-HSA-2500257 | Resolution of Sister Chromatid Cohesion | 3.037264 | 0.0000000 | 0.0000000 | 43/93 |
| R-HSA-2426168 | Activation of gene expression by SREBF (SREBP) | 3.010776 | 0.0003476 | 0.0071782 | 11/24 |
| R-HSA-8957322 | Metabolism of steroids | 2.996370 | 0.0000000 | 0.0000020 | 26/57 |
| R-HSA-1500620 | Meiosis | 2.985893 | 0.0000016 | 0.0000670 | 20/44 |
| R-HSA-2559586 | DNA Damage/Telomere Stress Induced Senescence | 2.985893 | 0.0000328 | 0.0009708 | 15/33 |
| R-HSA-141424 | Amplification of signal from the kinetochores | 2.977931 | 0.0000000 | 0.0000000 | 34/75 |
| R-HSA-141444 | Amplification of signal from unattached kinetochores via a MAD2 inhibitory signal | 2.977931 | 0.0000000 | 0.0000000 | 34/75 |
| R-HSA-212300 | PRC2 methylates histones and DNA | 2.956034 | 0.0014331 | 0.0198190 | 9/20 |
| R-HSA-69273 | Cyclin A/B1/B2 associated events during G2/M transition | 2.919540 | 0.0029193 | 0.0355112 | 8/18 |
| R-HSA-5663220 | RHO GTPases Activate Formins | 2.865187 | 0.0000000 | 0.0000000 | 41/94 |
| R-HSA-1474165 | Reproduction | 2.856072 | 0.0000037 | 0.0001493 | 20/46 |
| R-HSA-179409 | APC-Cdc20 mediated degradation of Nek2A | 2.856072 | 0.0010800 | 0.0174372 | 10/23 |
| R-HSA-201722 | Formation of the beta-catenin:TCF transactivating complex | 2.779178 | 0.0008043 | 0.0140046 | 11/26 |
| R-HSA-1655829 | Regulation of cholesterol biosynthesis by SREBP (SREBF) | 2.754727 | 0.0003002 | 0.0066640 | 13/31 |
| R-HSA-69618 | Mitotic Spindle Checkpoint | 2.730918 | 0.0000000 | 0.0000001 | 37/89 |
| R-HSA-5625740 | RHO GTPases activate PKNs | 2.718193 | 0.0005942 | 0.0112259 | 12/29 |
| R-HSA-977225 | Amyloid fiber formation | 2.627586 | 0.0023142 | 0.0302825 | 10/25 |
| R-HSA-68877 | Mitotic Prometaphase | 2.591837 | 0.0000000 | 0.0000000 | 58/147 |
| R-HSA-1912408 | Pre-NOTCH Transcription and Translation | 2.526525 | 0.0032579 | 0.0385731 | 10/26 |
| R-HSA-195258 | RHO GTPase Effectors | 2.493041 | 0.0000000 | 0.0000000 | 63/166 |
| R-HSA-2565942 | Regulation of PLK1 Activity at G2/M Transition | 2.425464 | 0.0000126 | 0.0004290 | 24/65 |
| R-HSA-8854518 | AURKA Activation by TPX2 | 2.388715 | 0.0000859 | 0.0021191 | 20/55 |
| R-HSA-2559582 | Senescence-Associated Secretory Phenotype (SASP) | 2.376009 | 0.0003134 | 0.0067871 | 17/47 |
| R-HSA-8950505 | Gene and protein expression by JAK-STAT signaling after Interleukin-12 stimulation | 2.330923 | 0.0042751 | 0.0486698 | 11/31 |
| R-HSA-194315 | Signaling by Rho GTPases | 2.284858 | 0.0000000 | 0.0000000 | 72/207 |
| R-HSA-9020591 | Interleukin-12 signaling | 2.252217 | 0.0039865 | 0.0465792 | 12/35 |
| R-HSA-5620912 | Anchoring of the basal body to the plasma membrane | 2.226768 | 0.0002607 | 0.0059358 | 20/59 |
| R-HSA-380320 | Recruitment of NuMA to mitotic centrosomes | 2.224972 | 0.0001860 | 0.0043459 | 21/62 |
| R-HSA-2467813 | Separation of Sister Chromatids | 2.218657 | 0.0000000 | 0.0000003 | 51/151 |
| R-HSA-2555396 | Mitotic Metaphase and Anaphase | 2.217026 | 0.0000000 | 0.0000001 | 54/160 |
| R-HSA-68882 | Mitotic Anaphase | 2.189655 | 0.0000000 | 0.0000003 | 53/159 |
| R-HSA-174143 | APC/C-mediated degradation of cell cycle proteins | 2.189655 | 0.0000444 | 0.0012329 | 26/78 |
| R-HSA-453276 | Regulation of mitotic cell cycle | 2.189655 | 0.0000444 | 0.0012329 | 26/78 |
| R-HSA-73886 | Chromosome Maintenance | 2.189655 | 0.0003366 | 0.0071159 | 20/60 |
| R-HSA-380259 | Loss of Nlp from mitotic centrosomes | 2.147546 | 0.0011919 | 0.0182232 | 17/52 |
| R-HSA-380284 | Loss of proteins required for interphase microtubule organization from the centrosome | 2.147546 | 0.0011919 | 0.0182232 | 17/52 |
| R-HSA-380270 | Recruitment of mitotic centrosome proteins and complexes | 2.046071 | 0.0012108 | 0.0182232 | 19/61 |
| R-HSA-380287 | Centrosome maturation | 2.046071 | 0.0012108 | 0.0182232 | 19/61 |
| R-HSA-69275 | G2/M Transition | 2.035454 | 0.0000010 | 0.0000483 | 44/142 |
| R-HSA-68886 | M Phase | 2.025019 | 0.0000000 | 0.0000000 | 82/266 |
| R-HSA-453274 | Mitotic G2-G2/M phases | 2.007184 | 0.0000016 | 0.0000670 | 44/144 |
| R-HSA-69620 | Cell Cycle Checkpoints | 2.001970 | 0.0000000 | 0.0000003 | 64/210 |
| GeneSet | description | enrichmentRatio | pValue | FDR | GeneRatio |
|---|---|---|---|---|---|
| R-HSA-389960 | Formation of tubulin folding intermediates by CCT/TriC | 3.278265 | 0.0000684 | 0.0015566 | 10/13 |
| R-HSA-156902 | Peptide chain elongation | 3.058429 | 0.0000000 | 0.0000000 | 61/85 |
| R-HSA-192823 | Viral mRNA Translation | 3.058429 | 0.0000000 | 0.0000000 | 61/85 |
| R-HSA-156842 | Eukaryotic Translation Elongation | 3.037106 | 0.0000000 | 0.0000000 | 62/87 |
| R-HSA-163210 | Formation of ATP by chemiosmotic coupling | 3.008291 | 0.0000489 | 0.0011436 | 12/17 |
| R-HSA-389958 | Cooperation of Prefoldin and TriC/CCT in actin and tubulin folding | 2.983221 | 0.0000128 | 0.0003153 | 14/20 |
| R-HSA-2408557 | Selenocysteine synthesis | 2.958152 | 0.0000000 | 0.0000000 | 59/85 |
| R-HSA-72764 | Eukaryotic Translation Termination | 2.954164 | 0.0000000 | 0.0000000 | 61/88 |
| R-HSA-975956 | Nonsense Mediated Decay (NMD) independent of the Exon Junction Complex (EJC) | 2.935869 | 0.0000000 | 0.0000000 | 62/90 |
| R-HSA-72689 | Formation of a pool of free 40S subunits | 2.929950 | 0.0000000 | 0.0000000 | 66/96 |
| R-HSA-389957 | Prefoldin mediated transfer of substrate to CCT/TriC | 2.915931 | 0.0000389 | 0.0009328 | 13/19 |
| R-HSA-156827 | L13a-mediated translational silencing of Ceruloplasmin expression | 2.814360 | 0.0000000 | 0.0000000 | 70/106 |
| R-HSA-1799339 | SRP-dependent cotranslational protein targeting to membrane | 2.788057 | 0.0000000 | 0.0000000 | 70/107 |
| R-HSA-72706 | GTP hydrolysis and joining of the 60S ribosomal subunit | 2.748228 | 0.0000000 | 0.0000000 | 69/107 |
| R-HSA-2408522 | Selenoamino acid metabolism | 2.668972 | 0.0000000 | 0.0000000 | 62/99 |
| R-HSA-72613 | Eukaryotic Translation Initiation | 2.616861 | 0.0000000 | 0.0000000 | 70/114 |
| R-HSA-72737 | Cap-dependent Translation Initiation | 2.616861 | 0.0000000 | 0.0000000 | 70/114 |
| R-HSA-927802 | Nonsense-Mediated Decay (NMD) | 2.604400 | 0.0000000 | 0.0000000 | 66/108 |
| R-HSA-975957 | Nonsense Mediated Decay (NMD) enhanced by the Exon Junction Complex (EJC) | 2.604400 | 0.0000000 | 0.0000000 | 66/108 |
| R-HSA-72695 | Formation of the ternary complex, and subsequently, the 43S complex | 2.574804 | 0.0000000 | 0.0000012 | 29/48 |
| R-HSA-72649 | Translation initiation complex formation | 2.479561 | 0.0000000 | 0.0000009 | 32/55 |
| R-HSA-8949613 | Cristae formation | 2.458699 | 0.0001744 | 0.0038724 | 15/26 |
| R-HSA-168273 | Influenza Viral RNA Transcription and Replication | 2.445263 | 0.0000000 | 0.0000000 | 70/122 |
| R-HSA-72662 | Activation of the mRNA upon binding of the cap-binding complex and eIFs, and subsequent binding to 43S | 2.435283 | 0.0000001 | 0.0000014 | 32/56 |
| R-HSA-72702 | Ribosomal scanning and start codon recognition | 2.402074 | 0.0000001 | 0.0000034 | 31/55 |
| R-HSA-168255 | Influenza Life Cycle | 2.374865 | 0.0000000 | 0.0000000 | 73/131 |
| R-HSA-168254 | Influenza Infection | 2.283078 | 0.0000000 | 0.0000000 | 75/140 |
| R-HSA-9010553 | Regulation of expression of SLITs and ROBOs | 2.274850 | 0.0000000 | 0.0000000 | 79/148 |
| R-HSA-376176 | Signaling by ROBO receptors | 2.130873 | 0.0000000 | 0.0000000 | 84/168 |
| R-HSA-909733 | Interferon alpha/beta signaling | 2.130873 | 0.0009251 | 0.0195598 | 16/32 |
| R-HSA-163200 | Respiratory electron transport, ATP synthesis by chemiosmotic coupling, and heat production by uncoupling proteins. | 2.073281 | 0.0000000 | 0.0000001 | 54/111 |
| R-HSA-8950505 | Gene and protein expression by JAK-STAT signaling after Interleukin-12 stimulation | 2.062135 | 0.0020340 | 0.0410491 | 15/31 |
| GeneSet | description | enrichmentRatio | pValue | FDR | GeneRatio |
|---|---|---|---|---|---|
| R-HSA-389957 | Prefoldin mediated transfer of substrate to CCT/TriC | 4.148820 | 0.0000000 | 0.0000010 | 15/19 |
| R-HSA-389958 | Cooperation of Prefoldin and TriC/CCT in actin and tubulin folding | 3.941379 | 0.0000001 | 0.0000029 | 15/20 |
| R-HSA-389960 | Formation of tubulin folding intermediates by CCT/TriC | 3.638196 | 0.0001071 | 0.0022643 | 9/13 |
| R-HSA-6814122 | Cooperation of PDCL (PhLP1) and TRiC/CCT in G-protein beta folding | 3.319056 | 0.0000280 | 0.0006534 | 12/19 |
| R-HSA-8876725 | Protein methylation | 3.233952 | 0.0008608 | 0.0136496 | 8/13 |
| R-HSA-198933 | Immunoregulatory interactions between a Lymphoid and a non-Lymphoid cell | 2.919540 | 0.0000010 | 0.0000301 | 20/36 |
| R-HSA-983170 | Antigen Presentation: Folding, assembly and peptide loading of class I MHC | 2.890345 | 0.0003445 | 0.0065369 | 11/20 |
| R-HSA-3299685 | Detoxification of Reactive Oxygen Species | 2.741829 | 0.0003533 | 0.0065369 | 12/23 |
| R-HSA-1799339 | SRP-dependent cotranslational protein targeting to membrane | 2.701257 | 0.0000000 | 0.0000000 | 55/107 |
| R-HSA-156902 | Peptide chain elongation | 2.658499 | 0.0000000 | 0.0000000 | 43/85 |
| R-HSA-156842 | Eukaryotic Translation Elongation | 2.657788 | 0.0000000 | 0.0000000 | 44/87 |
| R-HSA-5339562 | Uptake and actions of bacterial toxins | 2.627586 | 0.0050094 | 0.0383474 | 8/16 |
| R-HSA-5626467 | RHO GTPases activate IQGAPs | 2.627586 | 0.0050094 | 0.0383474 | 8/16 |
| R-HSA-192823 | Viral mRNA Translation | 2.596673 | 0.0000000 | 0.0000000 | 42/85 |
| R-HSA-975956 | Nonsense Mediated Decay (NMD) independent of the Exon Junction Complex (EJC) | 2.569195 | 0.0000000 | 0.0000000 | 44/90 |
| R-HSA-72764 | Eukaryotic Translation Termination | 2.567868 | 0.0000000 | 0.0000000 | 43/88 |
| R-HSA-1236975 | Antigen processing-Cross presentation | 2.554598 | 0.0000000 | 0.0000004 | 35/72 |
| R-HSA-2408557 | Selenocysteine synthesis | 2.534848 | 0.0000000 | 0.0000001 | 41/85 |
| R-HSA-1236974 | ER-Phagosome pathway | 2.473022 | 0.0000001 | 0.0000036 | 32/68 |
| R-HSA-72689 | Formation of a pool of free 40S subunits | 2.463362 | 0.0000000 | 0.0000000 | 45/96 |
| R-HSA-2408522 | Selenoamino acid metabolism | 2.388715 | 0.0000000 | 0.0000001 | 45/99 |
| R-HSA-191273 | Cholesterol biosynthesis | 2.364828 | 0.0069954 | 0.0463931 | 9/20 |
| R-HSA-156827 | L13a-mediated translational silencing of Ceruloplasmin expression | 2.330124 | 0.0000000 | 0.0000001 | 47/106 |
| R-HSA-114608 | Platelet degranulation | 2.299138 | 0.0000681 | 0.0015501 | 21/48 |
| R-HSA-2173789 | TGF-beta receptor signaling activates SMADs | 2.284858 | 0.0060708 | 0.0445525 | 10/23 |
| R-HSA-9010553 | Regulation of expression of SLITs and ROBOs | 2.272507 | 0.0000000 | 0.0000000 | 64/148 |
| R-HSA-72706 | GTP hydrolysis and joining of the 60S ribosomal subunit | 2.259233 | 0.0000000 | 0.0000003 | 46/107 |
| R-HSA-927802 | Nonsense-Mediated Decay (NMD) | 2.238314 | 0.0000000 | 0.0000004 | 46/108 |
| R-HSA-975957 | Nonsense Mediated Decay (NMD) enhanced by the Exon Junction Complex (EJC) | 2.238314 | 0.0000000 | 0.0000004 | 46/108 |
| R-HSA-76005 | Response to elevated platelet cytosolic Ca2+ | 2.223342 | 0.0000850 | 0.0018870 | 22/52 |
| R-HSA-72613 | Eukaryotic Translation Initiation | 2.212704 | 0.0000000 | 0.0000003 | 48/114 |
| R-HSA-72737 | Cap-dependent Translation Initiation | 2.212704 | 0.0000000 | 0.0000003 | 48/114 |
| R-HSA-390466 | Chaperonin-mediated protein folding | 2.189655 | 0.0002288 | 0.0046174 | 20/48 |
| R-HSA-391251 | Protein folding | 2.181392 | 0.0001198 | 0.0024730 | 22/53 |
| R-HSA-163200 | Respiratory electron transport, ATP synthesis by chemiosmotic coupling, and heat production by uncoupling proteins. | 2.130475 | 0.0000001 | 0.0000029 | 45/111 |
| R-HSA-1474244 | Extracellular matrix organization | 2.130475 | 0.0019252 | 0.0216385 | 15/37 |
| R-HSA-8854050 | FBXL7 down-regulates AURKA during mitotic entry and in early mitosis | 2.102069 | 0.0004384 | 0.0077857 | 20/50 |
| R-HSA-611105 | Respiratory electron transport | 2.090768 | 0.0000021 | 0.0000577 | 37/93 |
| R-HSA-5658442 | Regulation of RAS by GAPs | 2.082238 | 0.0003694 | 0.0066951 | 21/53 |
| R-HSA-376176 | Signaling by ROBO receptors | 2.064532 | 0.0000000 | 0.0000000 | 66/168 |
| R-HSA-168255 | Influenza Life Cycle | 2.045907 | 0.0000001 | 0.0000021 | 51/131 |
| R-HSA-4641258 | Degradation of DVL | 2.037720 | 0.0009556 | 0.0146308 | 19/49 |
| R-HSA-168273 | Influenza Viral RNA Transcription and Replication | 2.024534 | 0.0000003 | 0.0000084 | 47/122 |
| R-HSA-450408 | AUF1 (hnRNP D0) binds and destabilizes mRNA | 2.021220 | 0.0007979 | 0.0128817 | 20/52 |
| R-HSA-5358346 | Hedgehog ligand biogenesis | 2.021220 | 0.0007979 | 0.0128817 | 20/52 |
| R-HSA-5610783 | Degradation of GLI2 by the proteasome | 2.021220 | 0.0007979 | 0.0128817 | 20/52 |
| R-HSA-5610785 | GLI3 is processed to GLI3R by the proteasome | 2.021220 | 0.0007979 | 0.0128817 | 20/52 |
| R-HSA-9604323 | Negative regulation of NOTCH4 signaling | 2.021220 | 0.0007979 | 0.0128817 | 20/52 |
| R-HSA-5619115 | Disorders of transmembrane transporters | 2.014483 | 0.0003482 | 0.0065369 | 23/60 |
| R-HSA-8852276 | The role of GTSE1 in G2/M progression after G2 checkpoint | 2.014483 | 0.0003482 | 0.0065369 | 23/60 |
| R-HSA-180534 | Vpu mediated degradation of CD4 | 2.012619 | 0.0015298 | 0.0209000 | 18/47 |
| R-HSA-211733 | Regulation of activated PAK-2p34 by proteasome mediated degradation | 2.012619 | 0.0015298 | 0.0209000 | 18/47 |
| R-HSA-1236978 | Cross-presentation of soluble exogenous antigens (endosomes) | 2.001970 | 0.0029422 | 0.0266596 | 16/42 |
| GeneSet | description | enrichmentRatio | pValue | FDR | GeneRatio |
|---|---|---|---|---|---|
| R-HSA-202427 | Phosphorylation of CD3 and TCR zeta chains | 6.559917 | 0.0000003 | 0.0000384 | 10/16 |
| R-HSA-389948 | PD-1 signaling | 6.297521 | 0.0000018 | 0.0001296 | 9/15 |
| R-HSA-6783783 | Interleukin-10 signaling | 6.297521 | 0.0001083 | 0.0048067 | 6/10 |
| R-HSA-202430 | Translocation of ZAP-70 to Immunological synapse | 5.997639 | 0.0000113 | 0.0007177 | 8/14 |
| R-HSA-198933 | Immunoregulatory interactions between a Lymphoid and a non-Lymphoid cell | 5.831038 | 0.0000000 | 0.0000000 | 20/36 |
| R-HSA-373076 | Class A/1 (Rhodopsin-like receptors) | 5.247934 | 0.0000014 | 0.0001099 | 11/22 |
| R-HSA-216083 | Integrin cell surface interactions | 5.247934 | 0.0001279 | 0.0054066 | 7/14 |
| R-HSA-375276 | Peptide ligand-binding receptors | 5.247934 | 0.0004033 | 0.0127908 | 6/12 |
| R-HSA-500792 | GPCR ligand binding | 4.591942 | 0.0000004 | 0.0000401 | 14/32 |
| R-HSA-2172127 | DAP12 interactions | 4.198347 | 0.0017040 | 0.0423655 | 6/15 |
| R-HSA-2424491 | DAP12 signaling | 4.198347 | 0.0017040 | 0.0423655 | 6/15 |
| R-HSA-3299685 | Detoxification of Reactive Oxygen Species | 4.107079 | 0.0001427 | 0.0057579 | 9/23 |
| R-HSA-983695 | Antigen activates B Cell Receptor (BCR) leading to generation of second messengers | 3.998426 | 0.0004204 | 0.0128720 | 8/21 |
| R-HSA-202433 | Generation of second messenger molecules | 3.935950 | 0.0002093 | 0.0080815 | 9/24 |
| R-HSA-877300 | Interferon gamma signaling | 3.878908 | 0.0000004 | 0.0000401 | 17/46 |
| R-HSA-191273 | Cholesterol biosynthesis | 3.673554 | 0.0017409 | 0.0423655 | 7/20 |
| R-HSA-416476 | G alpha (q) signalling events | 3.417259 | 0.0000236 | 0.0014000 | 14/43 |
| R-HSA-388841 | Costimulation by the CD28 family | 3.327958 | 0.0000636 | 0.0029736 | 13/41 |
| R-HSA-202733 | Cell surface interactions at the vascular wall | 3.327958 | 0.0000636 | 0.0029736 | 13/41 |
| R-HSA-6785807 | Interleukin-4 and Interleukin-13 signaling | 3.207071 | 0.0003384 | 0.0120111 | 11/36 |
| R-HSA-1500931 | Cell-Cell communication | 3.047187 | 0.0017652 | 0.0423655 | 9/31 |
| R-HSA-114608 | Platelet degranulation | 2.842631 | 0.0003749 | 0.0123308 | 13/48 |
| R-HSA-76005 | Response to elevated platelet cytosolic Ca2+ | 2.825811 | 0.0002398 | 0.0088723 | 14/52 |
| R-HSA-76002 | Platelet activation, signaling and aggregation | 2.724889 | 0.0000007 | 0.0000627 | 27/104 |
| R-HSA-372790 | Signaling by GPCR | 2.666983 | 0.0000002 | 0.0000307 | 31/122 |
| R-HSA-388396 | GPCR downstream signalling | 2.623967 | 0.0000004 | 0.0000401 | 30/120 |
| R-HSA-418594 | G alpha (i) signalling events | 2.623967 | 0.0003517 | 0.0120111 | 15/60 |
| R-HSA-109582 | Hemostasis | 2.354213 | 0.0000000 | 0.0000023 | 48/214 |
| R-HSA-156842 | Eukaryotic Translation Elongation | 2.171559 | 0.0011070 | 0.0307183 | 18/87 |
| R-HSA-975956 | Nonsense Mediated Decay (NMD) independent of the Exon Junction Complex (EJC) | 2.099174 | 0.0016682 | 0.0423655 | 18/90 |
| R-HSA-156902 | Peptide chain elongation | 2.099174 | 0.0022293 | 0.0494909 | 17/85 |
| R-HSA-192823 | Viral mRNA Translation | 2.099174 | 0.0022293 | 0.0494909 | 17/85 |
| R-HSA-2408557 | Selenocysteine synthesis | 2.099174 | 0.0022293 | 0.0494909 | 17/85 |
| R-HSA-1799339 | SRP-dependent cotranslational protein targeting to membrane | 2.059937 | 0.0009077 | 0.0268681 | 21/107 |
| R-HSA-913531 | Interferon Signaling | 2.040863 | 0.0010301 | 0.0295071 | 21/108 |
| R-HSA-1280215 | Cytokine Signaling in Immune system | 2.039949 | 0.0000000 | 0.0000030 | 62/319 |
| GeneSet | description | enrichmentRatio | pValue | FDR | GeneRatio |
|---|---|---|---|---|---|
| R-HSA-156842 | Eukaryotic Translation Elongation | 10.124868 | 0.0000000 | 0.0000000 | 83/87 |
| R-HSA-156902 | Peptide chain elongation | 10.113387 | 0.0000000 | 0.0000000 | 81/85 |
| R-HSA-192823 | Viral mRNA Translation | 9.863674 | 0.0000000 | 0.0000000 | 79/85 |
| R-HSA-2408557 | Selenocysteine synthesis | 9.863674 | 0.0000000 | 0.0000000 | 79/85 |
| R-HSA-72764 | Eukaryotic Translation Termination | 9.527412 | 0.0000000 | 0.0000000 | 79/88 |
| R-HSA-975956 | Nonsense Mediated Decay (NMD) independent of the Exon Junction Complex (EJC) | 9.433612 | 0.0000000 | 0.0000000 | 80/90 |
| R-HSA-72689 | Formation of a pool of free 40S subunits | 9.396762 | 0.0000000 | 0.0000000 | 85/96 |
| R-HSA-156827 | L13a-mediated translational silencing of Ceruloplasmin expression | 8.710517 | 0.0000000 | 0.0000000 | 87/106 |
| R-HSA-2408522 | Selenoamino acid metabolism | 8.683211 | 0.0000000 | 0.0000000 | 81/99 |
| R-HSA-72706 | GTP hydrolysis and joining of the 60S ribosomal subunit | 8.529925 | 0.0000000 | 0.0000000 | 86/107 |
| R-HSA-1799339 | SRP-dependent cotranslational protein targeting to membrane | 8.331554 | 0.0000000 | 0.0000000 | 84/107 |
| R-HSA-72695 | Formation of the ternary complex, and subsequently, the 43S complex | 8.180710 | 0.0000000 | 0.0000000 | 37/48 |
| R-HSA-72613 | Eukaryotic Translation Initiation | 8.099252 | 0.0000000 | 0.0000000 | 87/114 |
| R-HSA-72737 | Cap-dependent Translation Initiation | 8.099252 | 0.0000000 | 0.0000000 | 87/114 |
| R-HSA-927802 | Nonsense-Mediated Decay (NMD) | 7.861343 | 0.0000000 | 0.0000000 | 80/108 |
| R-HSA-975957 | Nonsense Mediated Decay (NMD) enhanced by the Exon Junction Complex (EJC) | 7.861343 | 0.0000000 | 0.0000000 | 80/108 |
| R-HSA-72649 | Translation initiation complex formation | 7.525449 | 0.0000000 | 0.0000000 | 39/55 |
| R-HSA-72662 | Activation of the mRNA upon binding of the cap-binding complex and eIFs, and subsequent binding to 43S | 7.391066 | 0.0000000 | 0.0000000 | 39/56 |
| R-HSA-72702 | Ribosomal scanning and start codon recognition | 7.332489 | 0.0000000 | 0.0000000 | 38/55 |
| R-HSA-168273 | Influenza Viral RNA Transcription and Replication | 7.046212 | 0.0000000 | 0.0000000 | 81/122 |
| R-HSA-168255 | Influenza Life Cycle | 6.562121 | 0.0000000 | 0.0000000 | 81/131 |
| R-HSA-168254 | Influenza Infection | 6.216076 | 0.0000000 | 0.0000000 | 82/140 |
| R-HSA-9010553 | Regulation of expression of SLITs and ROBOs | 5.951780 | 0.0000000 | 0.0000000 | 83/148 |
| R-HSA-376176 | Signaling by ROBO receptors | 5.369578 | 0.0000000 | 0.0000000 | 85/168 |
| R-HSA-6791226 | Major pathway of rRNA processing in the nucleolus and cytosol | 5.339780 | 0.0000000 | 0.0000000 | 80/159 |
| R-HSA-70263 | Gluconeogenesis | 5.306407 | 0.0000120 | 0.0003121 | 9/18 |
| R-HSA-2979096 | NOTCH2 Activation and Transmission of Signal to the Nucleus | 5.306407 | 0.0012213 | 0.0258212 | 5/10 |
| R-HSA-8868773 | rRNA processing in the nucleus and cytosol | 5.023817 | 0.0000000 | 0.0000000 | 80/169 |
| R-HSA-1236382 | Constitutive Signaling by Ligand-Responsive EGFR Cancer Variants | 4.898222 | 0.0006491 | 0.0147798 | 6/13 |
| R-HSA-1643713 | Signaling by EGFR in Cancer | 4.898222 | 0.0006491 | 0.0147798 | 6/13 |
| R-HSA-5637815 | Signaling by Ligand-Responsive EGFR Variants in Cancer | 4.898222 | 0.0006491 | 0.0147798 | 6/13 |
| R-HSA-72312 | rRNA processing | 4.824006 | 0.0000000 | 0.0000000 | 80/176 |
| R-HSA-2122948 | Activated NOTCH1 Transmits Signal to the Nucleus | 4.824006 | 0.0020674 | 0.0407963 | 5/11 |
| R-HSA-9013507 | NOTCH3 Activation and Transmission of Signal to the Nucleus | 4.824006 | 0.0020674 | 0.0407963 | 5/11 |
| R-HSA-1980145 | Signaling by NOTCH2 | 4.548349 | 0.0010466 | 0.0226688 | 6/14 |
| R-HSA-6804760 | Regulation of TP53 Activity through Methylation | 4.548349 | 0.0010466 | 0.0226688 | 6/14 |
| R-HSA-71291 | Metabolism of amino acids and derivatives | 4.314555 | 0.0000000 | 0.0000000 | 87/214 |
| R-HSA-917937 | Iron uptake and transport | 4.245125 | 0.0000074 | 0.0001982 | 12/30 |
| R-HSA-8982491 | Glycogen metabolism | 4.245125 | 0.0016075 | 0.0331973 | 6/15 |
| R-HSA-72766 | Translation | 4.069575 | 0.0000000 | 0.0000000 | 102/266 |
| R-HSA-2672351 | Stimuli-sensing channels | 3.979805 | 0.0023706 | 0.0447891 | 6/16 |
| R-HSA-422475 | Axon guidance | 3.918577 | 0.0000000 | 0.0000000 | 96/260 |
| R-HSA-5663205 | Infectious disease | 3.204518 | 0.0000000 | 0.0000000 | 93/308 |
| R-HSA-70171 | Glycolysis | 3.032232 | 0.0003305 | 0.0081521 | 12/42 |
| R-HSA-1266738 | Developmental Biology | 2.994118 | 0.0000000 | 0.0000000 | 101/358 |
| R-HSA-70326 | Glucose metabolism | 2.497133 | 0.0021737 | 0.0419617 | 12/51 |
| R-HSA-71387 | Metabolism of carbohydrates | 2.266815 | 0.0001668 | 0.0042326 | 22/103 |
| GeneSet | description | enrichmentRatio | pValue | FDR | GeneRatio |
|---|---|---|---|---|---|
| R-HSA-216083 | Integrin cell surface interactions | 7.246407 | 0.0000004 | 0.0000523 | 9/14 |
| R-HSA-375276 | Peptide ligand-binding receptors | 6.575444 | 0.0000218 | 0.0021501 | 7/12 |
| R-HSA-373076 | Class A/1 (Rhodopsin-like receptors) | 6.148467 | 0.0000001 | 0.0000167 | 12/22 |
| R-HSA-6783783 | Interleukin-10 signaling | 5.636095 | 0.0009244 | 0.0432035 | 5/10 |
| R-HSA-198933 | Immunoregulatory interactions between a Lymphoid and a non-Lymphoid cell | 5.322978 | 0.0000000 | 0.0000007 | 17/36 |
| R-HSA-909733 | Interferon alpha/beta signaling | 4.931583 | 0.0000002 | 0.0000229 | 14/32 |
| R-HSA-6785807 | Interleukin-4 and Interleukin-13 signaling | 4.696746 | 0.0000001 | 0.0000215 | 15/36 |
| R-HSA-500792 | GPCR ligand binding | 4.579327 | 0.0000012 | 0.0001366 | 13/32 |
| R-HSA-1474244 | Extracellular matrix organization | 3.655845 | 0.0000471 | 0.0029855 | 12/37 |
| R-HSA-202733 | Cell surface interactions at the vascular wall | 3.574109 | 0.0000298 | 0.0024029 | 13/41 |
| R-HSA-877300 | Interferon gamma signaling | 3.430666 | 0.0000247 | 0.0021975 | 14/46 |
| R-HSA-114608 | Platelet degranulation | 2.818047 | 0.0007215 | 0.0376872 | 12/48 |
| R-HSA-76005 | Response to elevated platelet cytosolic Ca2+ | 2.818047 | 0.0004353 | 0.0241607 | 13/52 |
| R-HSA-449147 | Signaling by Interleukins | 2.297176 | 0.0000001 | 0.0000179 | 43/211 |
| R-HSA-913531 | Interferon Signaling | 2.191815 | 0.0003968 | 0.0234904 | 21/108 |
| R-HSA-1280215 | Cytokine Signaling in Immune system | 2.190833 | 0.0000000 | 0.0000005 | 62/319 |
| R-HSA-372790 | Signaling by GPCR | 2.032690 | 0.0008603 | 0.0424409 | 22/122 |
| GeneSet | description | enrichmentRatio | pValue | FDR | GeneRatio |
|---|---|---|---|---|---|
| R-HSA-202430 | Translocation of ZAP-70 to Immunological synapse | 8.123667 | 0.0000011 | 0.0000276 | 8/14 |
| R-HSA-389948 | PD-1 signaling | 7.582090 | 0.0000023 | 0.0000541 | 8/15 |
| R-HSA-198933 | Immunoregulatory interactions between a Lymphoid and a non-Lymphoid cell | 7.503109 | 0.0000000 | 0.0000000 | 19/36 |
| R-HSA-202427 | Phosphorylation of CD3 and TCR zeta chains | 7.108209 | 0.0000042 | 0.0000965 | 8/16 |
| R-HSA-5213460 | RIPK1-mediated regulated necrosis | 7.108209 | 0.0000176 | 0.0003641 | 7/14 |
| R-HSA-5218859 | Regulated Necrosis | 7.108209 | 0.0000176 | 0.0003641 | 7/14 |
| R-HSA-5675482 | Regulation of necroptotic cell death | 7.108209 | 0.0000176 | 0.0003641 | 7/14 |
| R-HSA-983170 | Antigen Presentation: Folding, assembly and peptide loading of class I MHC | 6.397388 | 0.0000031 | 0.0000728 | 9/20 |
| R-HSA-375276 | Peptide ligand-binding receptors | 5.923508 | 0.0008712 | 0.0151698 | 5/12 |
| R-HSA-156902 | Peptide chain elongation | 5.352063 | 0.0000000 | 0.0000000 | 32/85 |
| R-HSA-192823 | Viral mRNA Translation | 5.352063 | 0.0000000 | 0.0000000 | 32/85 |
| R-HSA-2408557 | Selenocysteine synthesis | 5.352063 | 0.0000000 | 0.0000000 | 32/85 |
| R-HSA-202433 | Generation of second messenger molecules | 5.331157 | 0.0000189 | 0.0003806 | 9/24 |
| R-HSA-72764 | Eukaryotic Translation Termination | 5.331157 | 0.0000000 | 0.0000000 | 33/88 |
| R-HSA-877300 | Interferon gamma signaling | 5.253894 | 0.0000000 | 0.0000002 | 17/46 |
| R-HSA-156842 | Eukaryotic Translation Elongation | 5.229027 | 0.0000000 | 0.0000000 | 32/87 |
| R-HSA-1489509 | DAG and IP3 signaling | 5.077292 | 0.0019588 | 0.0305156 | 5/14 |
| R-HSA-216083 | Integrin cell surface interactions | 5.077292 | 0.0019588 | 0.0305156 | 5/14 |
| R-HSA-975956 | Nonsense Mediated Decay (NMD) independent of the Exon Junction Complex (EJC) | 5.054726 | 0.0000000 | 0.0000000 | 32/90 |
| R-HSA-72689 | Formation of a pool of free 40S subunits | 5.034981 | 0.0000000 | 0.0000000 | 34/96 |
| R-HSA-909733 | Interferon alpha/beta signaling | 4.886894 | 0.0000058 | 0.0001288 | 11/32 |
| R-HSA-72695 | Formation of the ternary complex, and subsequently, the 43S complex | 4.738806 | 0.0000001 | 0.0000021 | 16/48 |
| R-HSA-2408522 | Selenoamino acid metabolism | 4.595206 | 0.0000000 | 0.0000000 | 32/99 |
| R-HSA-156827 | L13a-mediated translational silencing of Ceruloplasmin expression | 4.559983 | 0.0000000 | 0.0000000 | 34/106 |
| R-HSA-373076 | Class A/1 (Rhodopsin-like receptors) | 4.523406 | 0.0005363 | 0.0097187 | 7/22 |
| R-HSA-72706 | GTP hydrolysis and joining of the 60S ribosomal subunit | 4.517366 | 0.0000000 | 0.0000000 | 34/107 |
| R-HSA-1799339 | SRP-dependent cotranslational protein targeting to membrane | 4.384503 | 0.0000000 | 0.0000000 | 33/107 |
| R-HSA-72613 | Eukaryotic Translation Initiation | 4.239984 | 0.0000000 | 0.0000000 | 34/114 |
| R-HSA-72737 | Cap-dependent Translation Initiation | 4.239984 | 0.0000000 | 0.0000000 | 34/114 |
| R-HSA-927802 | Nonsense-Mediated Decay (NMD) | 4.212272 | 0.0000000 | 0.0000000 | 32/108 |
| R-HSA-975957 | Nonsense Mediated Decay (NMD) enhanced by the Exon Junction Complex (EJC) | 4.212272 | 0.0000000 | 0.0000000 | 32/108 |
| R-HSA-72649 | Translation initiation complex formation | 4.135685 | 0.0000006 | 0.0000152 | 16/55 |
| R-HSA-72702 | Ribosomal scanning and start codon recognition | 4.135685 | 0.0000006 | 0.0000152 | 16/55 |
| R-HSA-72662 | Activation of the mRNA upon binding of the cap-binding complex and eIFs, and subsequent binding to 43S | 4.061834 | 0.0000007 | 0.0000193 | 16/56 |
| R-HSA-168273 | Influenza Viral RNA Transcription and Replication | 3.728896 | 0.0000000 | 0.0000000 | 32/122 |
| R-HSA-168255 | Influenza Life Cycle | 3.581235 | 0.0000000 | 0.0000000 | 33/131 |
| R-HSA-500792 | GPCR ligand binding | 3.554105 | 0.0012834 | 0.0211051 | 8/32 |
| R-HSA-9010553 | Regulation of expression of SLITs and ROBOs | 3.458048 | 0.0000000 | 0.0000000 | 36/148 |
| R-HSA-168254 | Influenza Infection | 3.351013 | 0.0000000 | 0.0000000 | 33/140 |
| R-HSA-76005 | Response to elevated platelet cytosolic Ca2+ | 3.280712 | 0.0001857 | 0.0035086 | 12/52 |
| R-HSA-114608 | Platelet degranulation | 3.257929 | 0.0003681 | 0.0068090 | 11/48 |
| R-HSA-376176 | Signaling by ROBO receptors | 3.215618 | 0.0000000 | 0.0000000 | 38/168 |
| R-HSA-913531 | Interferon Signaling | 3.159204 | 0.0000002 | 0.0000067 | 24/108 |
| R-HSA-6785807 | Interleukin-4 and Interleukin-13 signaling | 3.159204 | 0.0028864 | 0.0427187 | 8/36 |
| R-HSA-6791226 | Major pathway of rRNA processing in the nucleolus and cytosol | 2.861166 | 0.0000000 | 0.0000008 | 32/159 |
| R-HSA-418594 | G alpha (i) signalling events | 2.843284 | 0.0007574 | 0.0134513 | 12/60 |
| R-HSA-8868773 | rRNA processing in the nucleus and cytosol | 2.775987 | 0.0000000 | 0.0000011 | 33/169 |
| R-HSA-71291 | Metabolism of amino acids and derivatives | 2.723706 | 0.0000000 | 0.0000000 | 41/214 |
| R-HSA-72312 | rRNA processing | 2.665578 | 0.0000001 | 0.0000028 | 33/176 |
| R-HSA-1236975 | Antigen processing-Cross presentation | 2.566853 | 0.0012678 | 0.0211051 | 13/72 |
| R-HSA-1236974 | ER-Phagosome pathway | 2.508780 | 0.0023746 | 0.0363552 | 12/68 |
| R-HSA-202424 | Downstream TCR signaling | 2.487873 | 0.0011440 | 0.0195364 | 14/80 |
| R-HSA-422475 | Axon guidance | 2.460534 | 0.0000000 | 0.0000002 | 45/260 |
| R-HSA-1280215 | Cytokine Signaling in Immune system | 2.361975 | 0.0000000 | 0.0000000 | 53/319 |
| R-HSA-5663205 | Infectious disease | 2.261703 | 0.0000000 | 0.0000005 | 49/308 |
| R-HSA-202403 | TCR signaling | 2.221315 | 0.0025167 | 0.0378791 | 15/96 |
| Factor | 1 | 2 | 3 | 4 | 5 | 6 | 7 | 8 | 9 | 10 |
| Signif_GO_terms | 0 | 0 | 0 | 8 | 1 | 21 | 34 | 58 | 40 | 2 |
| Factor | 11 | 12 | 13 | 14 | 15 | 16 | 17 | 18 | 19 | 20 |
| Signif_GO_terms | 33 | 36 | 33 | 57 | 32 | 53 | 36 | 47 | 17 | 56 |
5.3 KEGG Pathway Over-Representation Analysis
Gene sets: The KEGG pathway database.
| GeneSet | description | enrichmentRatio | pValue | FDR | GeneRatio |
|---|---|---|---|---|---|
| hsa04080 | Neuroactive ligand-receptor interaction | 2.092017 | 0.0002068 | 0.0044982 | 13/14 |
| hsa05332 | Graft-versus-host disease | 2.027647 | 0.0000269 | 0.0023412 | 18/20 |
| hsa05320 | Autoimmune thyroid disease | 2.015789 | 0.0000552 | 0.0025215 | 17/19 |
| hsa05330 | Allograft rejection | 2.015789 | 0.0000552 | 0.0025215 | 17/19 |
| GeneSet | description | enrichmentRatio | pValue | FDR | GeneRatio |
|---|---|---|---|---|---|
| hsa04640 | Hematopoietic cell lineage | 2.904417 | 0.0000000 | 0.0000000 | 26/30 |
| hsa04080 | Neuroactive ligand-receptor interaction | 2.633125 | 0.0002250 | 0.0036711 | 11/14 |
| hsa05150 | Staphylococcus aureus infection | 2.577885 | 0.0006031 | 0.0082843 | 10/13 |
| hsa05332 | Graft-versus-host disease | 2.513438 | 0.0000374 | 0.0011087 | 15/20 |
| hsa05320 | Autoimmune thyroid disease | 2.469342 | 0.0000958 | 0.0020845 | 14/19 |
| hsa05330 | Allograft rejection | 2.469342 | 0.0000958 | 0.0020845 | 14/19 |
| hsa04940 | Type I diabetes mellitus | 2.393750 | 0.0000949 | 0.0020845 | 15/21 |
| hsa04060 | Cytokine-cytokine receptor interaction | 2.345875 | 0.0000002 | 0.0000197 | 28/40 |
| hsa05322 | Systemic lupus erythematosus | 2.345875 | 0.0000058 | 0.0003052 | 21/30 |
| hsa04672 | Intestinal immune network for IgA production | 2.303984 | 0.0014447 | 0.0157116 | 11/16 |
| hsa04514 | Cell adhesion molecules (CAMs) | 2.292960 | 0.0000009 | 0.0000752 | 26/38 |
| hsa05416 | Viral myocarditis | 2.234167 | 0.0000304 | 0.0011087 | 20/30 |
| hsa04970 | Salivary secretion | 2.234167 | 0.0013084 | 0.0148476 | 12/18 |
| hsa04612 | Antigen processing and presentation | 2.182209 | 0.0000015 | 0.0000994 | 28/43 |
| hsa05321 | Inflammatory bowel disease (IBD) | 2.062308 | 0.0007524 | 0.0097953 | 16/26 |
| GeneSet | description | enrichmentRatio | pValue | FDR | GeneRatio |
|---|---|---|---|---|---|
| hsa05330 | Allograft rejection | 4.283128 | 0.0000000 | 0.0000000 | 18/19 |
| hsa04940 | Type I diabetes mellitus | 4.090500 | 0.0000000 | 0.0000000 | 19/21 |
| hsa05332 | Graft-versus-host disease | 4.068971 | 0.0000000 | 0.0000000 | 18/20 |
| hsa05320 | Autoimmune thyroid disease | 4.045176 | 0.0000000 | 0.0000000 | 17/19 |
| hsa04672 | Intestinal immune network for IgA production | 3.673377 | 0.0000008 | 0.0000185 | 13/16 |
| hsa05150 | Staphylococcus aureus infection | 3.477753 | 0.0000389 | 0.0006777 | 10/13 |
| hsa04514 | Cell adhesion molecules (CAMs) | 3.450297 | 0.0000000 | 0.0000000 | 29/38 |
| hsa04640 | Hematopoietic cell lineage | 3.164756 | 0.0000000 | 0.0000007 | 21/30 |
| hsa05322 | Systemic lupus erythematosus | 3.164756 | 0.0000000 | 0.0000007 | 21/30 |
| hsa03010 | Ribosome | 3.097117 | 0.0000000 | 0.0000000 | 87/127 |
| hsa04612 | Antigen processing and presentation | 3.049100 | 0.0000000 | 0.0000000 | 29/43 |
| hsa05416 | Viral myocarditis | 2.863350 | 0.0000012 | 0.0000250 | 19/30 |
| hsa05323 | Rheumatoid arthritis | 2.712648 | 0.0000012 | 0.0000250 | 21/35 |
| hsa05321 | Inflammatory bowel disease (IBD) | 2.608315 | 0.0000828 | 0.0013502 | 15/26 |
| hsa05140 | Leishmaniasis | 2.511711 | 0.0000114 | 0.0002132 | 20/36 |
| hsa05340 | Primary immunodeficiency | 2.466043 | 0.0008749 | 0.0108738 | 12/22 |
| hsa03060 | Protein export | 2.368184 | 0.0022272 | 0.0242208 | 11/21 |
| hsa04145 | Phagosome | 2.260540 | 0.0000002 | 0.0000049 | 35/70 |
| hsa04260 | Cardiac muscle contraction | 2.182590 | 0.0015841 | 0.0187933 | 14/29 |
| GeneSet | description | enrichmentRatio | pValue | FDR | GeneRatio |
|---|---|---|---|---|---|
| hsa04640 | Hematopoietic cell lineage | 5.140561 | 0.0000000 | 0.0000000 | 26/30 |
| hsa05332 | Graft-versus-host disease | 5.041703 | 0.0000000 | 0.0000000 | 17/20 |
| hsa05150 | Staphylococcus aureus infection | 5.018890 | 0.0000002 | 0.0000032 | 11/13 |
| hsa05330 | Allograft rejection | 4.994877 | 0.0000000 | 0.0000000 | 16/19 |
| hsa04514 | Cell adhesion molecules (CAMs) | 4.682697 | 0.0000000 | 0.0000000 | 30/38 |
| hsa05320 | Autoimmune thyroid disease | 4.682697 | 0.0000000 | 0.0000001 | 15/19 |
| hsa04940 | Type I diabetes mellitus | 4.519174 | 0.0000000 | 0.0000001 | 16/21 |
| hsa04672 | Intestinal immune network for IgA production | 4.448562 | 0.0000004 | 0.0000082 | 12/16 |
| hsa05416 | Viral myocarditis | 3.954277 | 0.0000000 | 0.0000001 | 20/30 |
| hsa04060 | Cytokine-cytokine receptor interaction | 3.558850 | 0.0000000 | 0.0000000 | 24/40 |
| hsa05340 | Primary immunodeficiency | 3.504928 | 0.0000086 | 0.0001252 | 13/22 |
| hsa05412 | Arrhythmogenic right ventricular cardiomyopathy (ARVC) | 3.459993 | 0.0013485 | 0.0103514 | 7/12 |
| hsa05321 | Inflammatory bowel disease (IBD) | 3.421971 | 0.0000026 | 0.0000395 | 15/26 |
| hsa04612 | Antigen processing and presentation | 3.310558 | 0.0000000 | 0.0000002 | 24/43 |
| hsa05410 | Hypertrophic cardiomyopathy (HCM) | 3.163422 | 0.0013127 | 0.0103514 | 8/15 |
| hsa05414 | Dilated cardiomyopathy (DCM) | 3.163422 | 0.0013127 | 0.0103514 | 8/15 |
| hsa05140 | Leishmaniasis | 3.130469 | 0.0000007 | 0.0000128 | 19/36 |
| hsa05323 | Rheumatoid arthritis | 3.050442 | 0.0000024 | 0.0000391 | 18/35 |
| hsa05322 | Systemic lupus erythematosus | 2.965708 | 0.0000266 | 0.0003307 | 15/30 |
| hsa04080 | Neuroactive ligand-receptor interaction | 2.965708 | 0.0042861 | 0.0294384 | 7/14 |
| hsa04658 | Th1 and Th2 cell differentiation | 2.909751 | 0.0000000 | 0.0000011 | 26/53 |
| hsa04650 | Natural killer cell mediated cytotoxicity | 2.851642 | 0.0000001 | 0.0000030 | 25/52 |
| hsa04659 | Th17 cell differentiation | 2.730334 | 0.0000000 | 0.0000011 | 29/63 |
| hsa04670 | Leukocyte transendothelial migration | 2.636185 | 0.0000116 | 0.0001587 | 20/45 |
| hsa05146 | Amoebiasis | 2.372566 | 0.0049560 | 0.0323378 | 10/25 |
| hsa04630 | JAK-STAT signaling pathway | 2.178888 | 0.0005936 | 0.0053426 | 18/49 |
| hsa05145 | Toxoplasmosis | 2.118363 | 0.0004565 | 0.0045822 | 20/56 |
| hsa04662 | B cell receptor signaling pathway | 2.118363 | 0.0023411 | 0.0167631 | 15/42 |
| hsa04660 | T cell receptor signaling pathway | 2.063101 | 0.0001993 | 0.0023647 | 24/69 |
| hsa05206 | MicroRNAs in cancer | 2.036158 | 0.0003376 | 0.0035244 | 23/67 |
| hsa04145 | Phagosome | 2.033628 | 0.0002565 | 0.0027899 | 24/70 |
| GeneSet | description | enrichmentRatio | pValue | FDR | GeneRatio |
|---|---|---|---|---|---|
| hsa04672 | Intestinal immune network for IgA production | 3.051635 | 0.0000993 | 0.0024845 | 11/16 |
| hsa04940 | Type I diabetes mellitus | 2.959161 | 0.0000179 | 0.0018841 | 14/21 |
| hsa05332 | Graft-versus-host disease | 2.885182 | 0.0000542 | 0.0018841 | 13/20 |
| hsa05320 | Autoimmune thyroid disease | 2.803416 | 0.0001602 | 0.0029869 | 12/19 |
| hsa05330 | Allograft rejection | 2.803416 | 0.0001602 | 0.0029869 | 12/19 |
| hsa05150 | Staphylococcus aureus infection | 2.731533 | 0.0027496 | 0.0299014 | 8/13 |
| hsa04640 | Hematopoietic cell lineage | 2.515287 | 0.0000485 | 0.0018841 | 17/30 |
| hsa05416 | Viral myocarditis | 2.515287 | 0.0000485 | 0.0018841 | 17/30 |
| hsa04666 | Fc gamma R-mediated phagocytosis | 2.441308 | 0.0000071 | 0.0018543 | 22/40 |
| hsa05130 | Pathogenic Escherichia coli infection | 2.421132 | 0.0000577 | 0.0018841 | 18/33 |
| hsa04514 | Cell adhesion molecules (CAMs) | 2.336180 | 0.0000443 | 0.0018841 | 20/38 |
| hsa04060 | Cytokine-cytokine receptor interaction | 2.219371 | 0.0001142 | 0.0024845 | 20/40 |
| hsa05140 | Leishmaniasis | 2.219371 | 0.0002523 | 0.0043650 | 18/36 |
| hsa04650 | Natural killer cell mediated cytotoxicity | 2.134010 | 0.0000375 | 0.0018841 | 25/52 |
| hsa05132 | Salmonella infection | 2.113687 | 0.0002676 | 0.0043650 | 20/42 |
| hsa05323 | Rheumatoid arthritis | 2.029139 | 0.0018977 | 0.0227493 | 16/35 |
| GeneSet | description | enrichmentRatio | pValue | FDR | GeneRatio |
|---|---|---|---|---|---|
| hsa05320 | Autoimmune thyroid disease | 3.176003 | 4.10e-06 | 0.0001792 | 14/19 |
| hsa05330 | Allograft rejection | 3.176003 | 4.10e-06 | 0.0001792 | 14/19 |
| hsa04940 | Type I diabetes mellitus | 3.078778 | 3.40e-06 | 0.0001792 | 15/21 |
| hsa05332 | Graft-versus-host disease | 3.017203 | 1.08e-05 | 0.0004035 | 14/20 |
| hsa05322 | Systemic lupus erythematosus | 2.729850 | 2.70e-06 | 0.0001792 | 19/30 |
| hsa05416 | Viral myocarditis | 2.729850 | 2.70e-06 | 0.0001792 | 19/30 |
| hsa04612 | Antigen processing and presentation | 2.505982 | 7.00e-07 | 0.0001792 | 25/43 |
| GeneSet | description | enrichmentRatio | pValue | FDR | GeneRatio |
|---|---|---|---|---|---|
| hsa05410 | Hypertrophic cardiomyopathy (HCM) | 4.622414 | 0.0000002 | 0.0000092 | 12/15 |
| hsa05414 | Dilated cardiomyopathy (DCM) | 4.237213 | 0.0000026 | 0.0001143 | 11/15 |
| hsa05412 | Arrhythmogenic right ventricular cardiomyopathy (ARVC) | 3.852012 | 0.0001967 | 0.0030198 | 8/12 |
| hsa04640 | Hematopoietic cell lineage | 3.659411 | 0.0000000 | 0.0000018 | 19/30 |
| hsa05330 | Allograft rejection | 3.345168 | 0.0000743 | 0.0017625 | 11/19 |
| hsa04060 | Cytokine-cytokine receptor interaction | 3.322360 | 0.0000000 | 0.0000012 | 23/40 |
| hsa04940 | Type I diabetes mellitus | 3.301724 | 0.0000410 | 0.0011904 | 12/21 |
| hsa04514 | Cell adhesion molecules (CAMs) | 3.193115 | 0.0000001 | 0.0000068 | 21/38 |
| hsa05332 | Graft-versus-host disease | 3.177910 | 0.0001396 | 0.0024784 | 11/20 |
| hsa05150 | Staphylococcus aureus infection | 3.111240 | 0.0029282 | 0.0191064 | 7/13 |
| hsa05320 | Autoimmune thyroid disease | 3.041062 | 0.0004574 | 0.0053027 | 10/19 |
| hsa04650 | Natural killer cell mediated cytotoxicity | 3.000124 | 0.0000000 | 0.0000012 | 27/52 |
| hsa04970 | Salivary secretion | 2.889009 | 0.0014358 | 0.0124914 | 9/18 |
| hsa05140 | Leishmaniasis | 2.728508 | 0.0000287 | 0.0009364 | 17/36 |
| hsa05416 | Viral myocarditis | 2.696408 | 0.0001744 | 0.0028441 | 14/30 |
| hsa04918 | Thyroid hormone synthesis | 2.512181 | 0.0029256 | 0.0191064 | 10/23 |
| hsa04971 | Gastric acid secretion | 2.432849 | 0.0096779 | 0.0451060 | 8/19 |
| hsa04612 | Antigen processing and presentation | 2.418705 | 0.0001209 | 0.0024275 | 18/43 |
| hsa05340 | Primary immunodeficiency | 2.363734 | 0.0076529 | 0.0407633 | 9/22 |
| hsa04015 | Rap1 signaling pathway | 2.329846 | 0.0000127 | 0.0004742 | 25/62 |
| hsa04658 | Th1 and Th2 cell differentiation | 2.289403 | 0.0000867 | 0.0018862 | 21/53 |
| hsa05321 | Inflammatory bowel disease (IBD) | 2.222314 | 0.0083033 | 0.0423392 | 10/26 |
| hsa04659 | Th17 cell differentiation | 2.201149 | 0.0000579 | 0.0015106 | 24/63 |
| hsa04064 | NF-kappa B signaling pathway | 2.182806 | 0.0007911 | 0.0086035 | 17/45 |
| hsa05323 | Rheumatoid arthritis | 2.146121 | 0.0038740 | 0.0236763 | 13/35 |
| hsa04921 | Oxytocin signaling pathway | 2.135354 | 0.0010584 | 0.0101044 | 17/46 |
| hsa05322 | Systemic lupus erythematosus | 2.118606 | 0.0086268 | 0.0423392 | 11/30 |
| hsa04915 | Estrogen signaling pathway | 2.101097 | 0.0018045 | 0.0144093 | 16/44 |
| hsa04912 | GnRH signaling pathway | 2.086506 | 0.0051305 | 0.0297570 | 13/36 |
| hsa04625 | C-type lectin receptor signaling pathway | 2.080086 | 0.0010840 | 0.0101044 | 18/50 |
| hsa05132 | Salmonella infection | 2.063578 | 0.0030589 | 0.0194727 | 15/42 |
| hsa04670 | Leukocyte transendothelial migration | 2.054406 | 0.0023636 | 0.0166731 | 16/45 |
| hsa04380 | Osteoclast differentiation | 2.000083 | 0.0018219 | 0.0144093 | 18/52 |
| GeneSet | description | enrichmentRatio | pValue | FDR | GeneRatio |
|---|---|---|---|---|---|
| hsa00100 | Steroid biosynthesis | 5.070449 | 0.0000121 | 0.0010564 | 8/10 |
| hsa00900 | Terpenoid backbone biosynthesis | 3.380299 | 0.0008310 | 0.0433802 | 8/15 |
| hsa04114 | Oocyte meiosis | 2.453443 | 0.0000084 | 0.0010564 | 24/62 |
| hsa05034 | Alcoholism | 2.281702 | 0.0003406 | 0.0222238 | 18/50 |
| hsa04110 | Cell cycle | 2.180838 | 0.0000052 | 0.0010564 | 32/93 |
| GeneSet | description | enrichmentRatio | pValue | FDR | GeneRatio |
|---|---|---|---|---|---|
| hsa05330 | Allograft rejection | 2.309759 | 0.0022587 | 0.0491263 | 11/19 |
| hsa04940 | Type I diabetes mellitus | 2.279762 | 0.0016576 | 0.0393293 | 12/21 |
| hsa03010 | Ribosome | 2.261811 | 0.0000000 | 0.0000000 | 72/127 |
| hsa05322 | Systemic lupus erythematosus | 2.260764 | 0.0002048 | 0.0066813 | 17/30 |
| hsa04260 | Cardiac muscle contraction | 2.201149 | 0.0004772 | 0.0138387 | 16/29 |
| hsa00190 | Oxidative phosphorylation | 2.139867 | 0.0000000 | 0.0000000 | 59/110 |
| hsa05012 | Parkinson disease | 2.068673 | 0.0000000 | 0.0000001 | 56/108 |
| hsa05130 | Pathogenic Escherichia coli infection | 2.055240 | 0.0009123 | 0.0238111 | 17/33 |
| GeneSet | description | enrichmentRatio | pValue | FDR | GeneRatio |
|---|---|---|---|---|---|
| hsa04971 | Gastric acid secretion | 2.718315 | 0.0005240 | 0.0136759 | 11/19 |
| hsa03060 | Protein export | 2.683012 | 0.0003414 | 0.0111368 | 12/21 |
| hsa05416 | Viral myocarditis | 2.347636 | 0.0004396 | 0.0127483 | 15/30 |
| hsa04260 | Cardiac muscle contraction | 2.266683 | 0.0010682 | 0.0199136 | 14/29 |
| hsa05010 | Alzheimer disease | 2.100516 | 0.0000000 | 0.0000011 | 51/114 |
| hsa04514 | Cell adhesion molecules (CAMs) | 2.100516 | 0.0009471 | 0.0190140 | 17/38 |
| hsa05012 | Parkinson disease | 2.086787 | 0.0000000 | 0.0000027 | 48/108 |
| hsa04612 | Antigen processing and presentation | 2.074655 | 0.0005788 | 0.0137341 | 19/43 |
| hsa03010 | Ribosome | 2.070356 | 0.0000000 | 0.0000007 | 56/127 |
| hsa05034 | Alcoholism | 2.065919 | 0.0002313 | 0.0086250 | 22/50 |
| GeneSet | description | enrichmentRatio | pValue | FDR | GeneRatio |
|---|---|---|---|---|---|
| hsa05150 | Staphylococcus aureus infection | 7.365385 | 0.0000000 | 0.0000008 | 10/13 |
| hsa05332 | Graft-versus-host disease | 7.181250 | 0.0000000 | 0.0000000 | 15/20 |
| hsa05330 | Allograft rejection | 7.055263 | 0.0000000 | 0.0000000 | 14/19 |
| hsa04940 | Type I diabetes mellitus | 6.839286 | 0.0000000 | 0.0000000 | 15/21 |
| hsa05320 | Autoimmune thyroid disease | 6.551316 | 0.0000000 | 0.0000001 | 13/19 |
| hsa04640 | Hematopoietic cell lineage | 6.383333 | 0.0000000 | 0.0000000 | 20/30 |
| hsa04672 | Intestinal immune network for IgA production | 5.984375 | 0.0000006 | 0.0000136 | 10/16 |
| hsa04514 | Cell adhesion molecules (CAMs) | 5.795395 | 0.0000000 | 0.0000000 | 23/38 |
| hsa05416 | Viral myocarditis | 5.745000 | 0.0000000 | 0.0000000 | 18/30 |
| hsa05412 | Arrhythmogenic right ventricular cardiomyopathy (ARVC) | 5.585417 | 0.0000629 | 0.0007818 | 7/12 |
| hsa04060 | Cytokine-cytokine receptor interaction | 5.026875 | 0.0000000 | 0.0000000 | 21/40 |
| hsa05414 | Dilated cardiomyopathy (DCM) | 4.468333 | 0.0003869 | 0.0037398 | 7/15 |
| hsa05322 | Systemic lupus erythematosus | 4.149167 | 0.0000031 | 0.0000543 | 13/30 |
| hsa05323 | Rheumatoid arthritis | 4.103571 | 0.0000006 | 0.0000136 | 15/35 |
| hsa04080 | Neuroactive ligand-receptor interaction | 4.103571 | 0.0017887 | 0.0141467 | 6/14 |
| hsa05321 | Inflammatory bowel disease (IBD) | 4.050961 | 0.0000245 | 0.0003193 | 11/26 |
| hsa04612 | Antigen processing and presentation | 4.008140 | 0.0000001 | 0.0000018 | 18/43 |
| hsa05140 | Leishmaniasis | 3.989583 | 0.0000010 | 0.0000196 | 15/36 |
| hsa05410 | Hypertrophic cardiomyopathy (HCM) | 3.830000 | 0.0027232 | 0.0193311 | 6/15 |
| hsa04970 | Salivary secretion | 3.723611 | 0.0014501 | 0.0122091 | 7/18 |
| hsa01040 | Biosynthesis of unsaturated fatty acids | 3.682692 | 0.0076150 | 0.0414065 | 5/13 |
| hsa04750 | Inflammatory mediator regulation of TRP channels | 3.546296 | 0.0002204 | 0.0022124 | 10/27 |
| hsa04971 | Gastric acid secretion | 3.527632 | 0.0020940 | 0.0156155 | 7/19 |
| hsa05020 | Prion diseases | 3.419643 | 0.0108518 | 0.0472055 | 5/14 |
| hsa05145 | Toxoplasmosis | 3.248661 | 0.0000015 | 0.0000276 | 19/56 |
| hsa04650 | Natural killer cell mediated cytotoxicity | 3.130288 | 0.0000096 | 0.0001563 | 17/52 |
| hsa04658 | Th1 and Th2 cell differentiation | 3.071226 | 0.0000128 | 0.0001854 | 17/53 |
| hsa05340 | Primary immunodeficiency | 3.046591 | 0.0053817 | 0.0326655 | 7/22 |
| hsa04924 | Renin secretion | 3.023684 | 0.0102994 | 0.0455706 | 6/19 |
| hsa04925 | Aldosterone synthesis and secretion | 2.971552 | 0.0019722 | 0.0151393 | 9/29 |
| hsa04713 | Circadian entrainment | 2.914130 | 0.0070600 | 0.0392058 | 7/23 |
| hsa04270 | Vascular smooth muscle contraction | 2.779839 | 0.0032899 | 0.0216530 | 9/31 |
| hsa04611 | Platelet activation | 2.766111 | 0.0004453 | 0.0041506 | 13/45 |
| hsa04145 | Phagosome | 2.735714 | 0.0000155 | 0.0002128 | 20/70 |
| hsa05146 | Amoebiasis | 2.681000 | 0.0115351 | 0.0493551 | 7/25 |
| hsa04015 | Rap1 signaling pathway | 2.625403 | 0.0001216 | 0.0013219 | 17/62 |
| hsa04659 | Th17 cell differentiation | 2.583730 | 0.0001510 | 0.0015764 | 17/63 |
| hsa05164 | Influenza A | 2.560756 | 0.0000118 | 0.0001816 | 23/86 |
| hsa04720 | Long-term potentiation | 2.534559 | 0.0064626 | 0.0374830 | 9/34 |
| hsa05418 | Fluid shear stress and atherosclerosis | 2.489500 | 0.0013364 | 0.0116267 | 13/50 |
| hsa04928 | Parathyroid hormone synthesis, secretion and action | 2.462143 | 0.0079236 | 0.0416293 | 9/35 |
| hsa04810 | Regulation of actin cytoskeleton | 2.424051 | 0.0001051 | 0.0011926 | 20/79 |
| hsa04912 | GnRH signaling pathway | 2.393750 | 0.0096235 | 0.0440867 | 9/36 |
| hsa04630 | JAK-STAT signaling pathway | 2.344898 | 0.0035193 | 0.0224033 | 12/49 |
| hsa04921 | Oxytocin signaling pathway | 2.289674 | 0.0062443 | 0.0370398 | 11/46 |
| hsa04020 | Calcium signaling pathway | 2.279762 | 0.0092818 | 0.0440462 | 10/42 |
| hsa05132 | Salmonella infection | 2.279762 | 0.0092818 | 0.0440462 | 10/42 |
| hsa05168 | Herpes simplex infection | 2.231068 | 0.0000907 | 0.0010756 | 24/103 |
| hsa05152 | Tuberculosis | 2.191867 | 0.0006340 | 0.0057061 | 19/83 |
| hsa05205 | Proteoglycans in cancer | 2.098630 | 0.0027404 | 0.0193311 | 16/73 |
| hsa04510 | Focal adhesion | 2.051786 | 0.0046395 | 0.0288311 | 15/70 |
| hsa04910 | Insulin signaling pathway | 2.040574 | 0.0086038 | 0.0440310 | 13/61 |
| hsa04210 | Apoptosis | 2.009568 | 0.0033185 | 0.0216530 | 17/81 |
| GeneSet | description | enrichmentRatio | pValue | FDR | GeneRatio |
|---|---|---|---|---|---|
| hsa03010 | Ribosome | 5.656991 | 0.0e+00 | 0.0000000 | 82/127 |
| hsa00010 | Glycolysis / Gluconeogenesis | 3.796623 | 8.6e-06 | 0.0007457 | 13/30 |
| hsa04060 | Cytokine-cytokine receptor interaction | 3.723611 | 5.0e-07 | 0.0000611 | 17/40 |
| GeneSet | description | enrichmentRatio | pValue | FDR | GeneRatio |
|---|---|---|---|---|---|
| hsa05412 | Arrhythmogenic right ventricular cardiomyopathy (ARVC) | 4.839350 | 0.0006221 | 0.0147614 | 6/12 |
| hsa04080 | Neuroactive ligand-receptor interaction | 4.839350 | 0.0002113 | 0.0068945 | 7/14 |
| hsa00100 | Steroid biosynthesis | 4.839350 | 0.0018490 | 0.0320560 | 5/10 |
| hsa04672 | Intestinal immune network for IgA production | 4.234431 | 0.0005866 | 0.0147614 | 7/16 |
| hsa04514 | Cell adhesion molecules (CAMs) | 4.075242 | 0.0000003 | 0.0000785 | 16/38 |
| hsa04060 | Cytokine-cytokine receptor interaction | 3.871480 | 0.0000007 | 0.0000914 | 16/40 |
| hsa05332 | Graft-versus-host disease | 3.871480 | 0.0004879 | 0.0141487 | 8/20 |
| hsa05410 | Hypertrophic cardiomyopathy (HCM) | 3.871480 | 0.0025751 | 0.0353740 | 6/15 |
| hsa05414 | Dilated cardiomyopathy (DCM) | 3.871480 | 0.0025751 | 0.0353740 | 6/15 |
| hsa05320 | Autoimmune thyroid disease | 3.565837 | 0.0019651 | 0.0320560 | 7/19 |
| hsa05330 | Allograft rejection | 3.565837 | 0.0019651 | 0.0320560 | 7/19 |
| hsa04640 | Hematopoietic cell lineage | 3.548857 | 0.0001066 | 0.0046390 | 11/30 |
| hsa05140 | Leishmaniasis | 3.226234 | 0.0001498 | 0.0055843 | 12/36 |
| hsa04940 | Type I diabetes mellitus | 3.226234 | 0.0037816 | 0.0469997 | 7/21 |
| hsa04650 | Natural killer cell mediated cytotoxicity | 3.164191 | 0.0000083 | 0.0005391 | 17/52 |
| hsa05206 | MicroRNAs in cancer | 3.033622 | 0.0000015 | 0.0001307 | 21/67 |
| hsa05416 | Viral myocarditis | 2.903610 | 0.0023780 | 0.0353740 | 9/30 |
| hsa04630 | JAK-STAT signaling pathway | 2.370294 | 0.0032144 | 0.0419479 | 12/49 |
| hsa04659 | Th17 cell differentiation | 2.304453 | 0.0013830 | 0.0277671 | 15/63 |
| hsa04621 | NOD-like receptor signaling pathway | 2.124593 | 0.0013057 | 0.0277671 | 18/82 |
| GeneSet | description | enrichmentRatio | pValue | FDR | GeneRatio |
|---|---|---|---|---|---|
| hsa05332 | Graft-versus-host disease | 9.532444 | 0.0000000 | 0.0000000 | 16/20 |
| hsa05320 | Autoimmune thyroid disease | 9.407018 | 0.0000000 | 0.0000000 | 15/19 |
| hsa05330 | Allograft rejection | 9.407018 | 0.0000000 | 0.0000000 | 15/19 |
| hsa04940 | Type I diabetes mellitus | 9.078518 | 0.0000000 | 0.0000000 | 16/21 |
| hsa05150 | Staphylococcus aureus infection | 8.249231 | 0.0000001 | 0.0000022 | 9/13 |
| hsa04672 | Intestinal immune network for IgA production | 7.447222 | 0.0000001 | 0.0000019 | 10/16 |
| hsa04640 | Hematopoietic cell lineage | 7.149333 | 0.0000000 | 0.0000000 | 18/30 |
| hsa04612 | Antigen processing and presentation | 6.650543 | 0.0000000 | 0.0000000 | 24/43 |
| hsa04514 | Cell adhesion molecules (CAMs) | 6.271345 | 0.0000000 | 0.0000000 | 20/38 |
| hsa05416 | Viral myocarditis | 5.957778 | 0.0000000 | 0.0000001 | 15/30 |
| hsa05321 | Inflammatory bowel disease (IBD) | 5.041197 | 0.0000029 | 0.0000512 | 11/26 |
| hsa05322 | Systemic lupus erythematosus | 4.369037 | 0.0000149 | 0.0002287 | 11/30 |
| hsa05140 | Leishmaniasis | 4.302840 | 0.0000029 | 0.0000512 | 13/36 |
| hsa04060 | Cytokine-cytokine receptor interaction | 4.170444 | 0.0000019 | 0.0000405 | 14/40 |
| hsa05323 | Rheumatoid arthritis | 3.744889 | 0.0000779 | 0.0011289 | 11/35 |
| hsa04145 | Phagosome | 3.234222 | 0.0000022 | 0.0000447 | 19/70 |
| hsa03010 | Ribosome | 3.189991 | 0.0000000 | 0.0000000 | 34/127 |
| hsa05145 | Toxoplasmosis | 2.978889 | 0.0001369 | 0.0018801 | 14/56 |
| hsa05168 | Herpes simplex infection | 2.660755 | 0.0000073 | 0.0001196 | 23/103 |
| hsa04659 | Th17 cell differentiation | 2.647901 | 0.0005166 | 0.0064205 | 14/63 |
| hsa04658 | Th1 and Th2 cell differentiation | 2.473040 | 0.0036579 | 0.0381888 | 11/53 |
| hsa05169 | Epstein-Barr virus infection | 2.183003 | 0.0001479 | 0.0019307 | 24/131 |
| hsa05152 | Tuberculosis | 2.153414 | 0.0030987 | 0.0336983 | 15/83 |
| hsa05163 | Human cytomegalovirus infection | 2.021389 | 0.0019548 | 0.0221830 | 19/112 |
| Factor | 1 | 2 | 3 | 4 | 5 | 6 | 7 | 8 | 9 | 10 |
| Signif_GO_terms | 0 | 0 | 0 | 4 | 0 | 0 | 15 | 19 | 31 | 0 |
| Factor | 11 | 12 | 13 | 14 | 15 | 16 | 17 | 18 | 19 | 20 |
| Signif_GO_terms | 16 | 7 | 33 | 5 | 8 | 10 | 53 | 3 | 20 | 24 |
5.4 Wikipathway Over-Representation Analysis
Gene sets: The Wikipathway database.
| GeneSet | description | enrichmentRatio | pValue | FDR | GeneRatio |
|---|---|---|---|---|---|
| WP531 | DNA Mismatch Repair | 2.019353 | 8.69e-05 | 0.0043144 | 15/16 |
| GeneSet | description | enrichmentRatio | pValue | FDR | GeneRatio |
|---|---|---|---|---|---|
| WP455 | GPCRs, Class A Rhodopsin-like | 2.667831 | 0.0000520 | 0.0038769 | 12/14 |
| WP3613 | Photodynamic therapy-induced unfolded protein response | 2.334352 | 0.0005217 | 0.0233026 | 12/16 |
| WP2840 | Hair Follicle Development: Cytodifferentiation (Part 3 of 3) | 2.247895 | 0.0005474 | 0.0233026 | 13/18 |
| WP2328 | Allograft Rejection | 2.208849 | 0.0000094 | 0.0009314 | 22/31 |
| WP2877 | Vitamin D Receptor Pathway | 2.100917 | 0.0000040 | 0.0006007 | 27/40 |
| GeneSet | description | enrichmentRatio | pValue | FDR | GeneRatio |
|---|---|---|---|---|---|
| WP477 | Cytoplasmic Ribosomal Proteins | 4.400657 | 0.0000000 | 0.0000000 | 80/84 |
| WP2328 | Allograft Rejection | 3.279199 | 0.0000000 | 0.0000007 | 22/31 |
| WP4585 | Cancer immunotherapy by PD-1 blockade | 2.675136 | 0.0006052 | 0.0360720 | 11/19 |
| WP4217 | Ebola Virus Pathway on Host | 2.152102 | 0.0000013 | 0.0001328 | 34/73 |
| WP2431 | Spinal Cord Injury | 2.123020 | 0.0007863 | 0.0390541 | 17/37 |
| GeneSet | description | enrichmentRatio | pValue | FDR | GeneRatio |
|---|---|---|---|---|---|
| WP455 | GPCRs, Class A Rhodopsin-like | 4.256231 | 0.0000016 | 0.0001617 | 11/14 |
| WP2328 | Allograft Rejection | 4.193823 | 0.0000000 | 0.0000000 | 24/31 |
| WP4494 | Selective expression of chemokine receptors during T-cell polarization | 3.791915 | 0.0005025 | 0.0213921 | 7/10 |
| WP4585 | Cancer immunotherapy by PD-1 blockade | 3.706383 | 0.0000023 | 0.0001700 | 13/19 |
| WP2118 | Arrhythmogenic Right Ventricular Cardiomyopathy | 3.095441 | 0.0013460 | 0.0445663 | 8/14 |
| WP4538 | Regulatory circuits of the STAT3 signaling pathway | 2.527943 | 0.0003537 | 0.0175688 | 14/30 |
| WP4217 | Ebola Virus Pathway on Host | 2.300379 | 0.0000012 | 0.0001617 | 31/73 |
| WP4298 | Viral Acute Myocarditis | 2.141613 | 0.0009225 | 0.0343614 | 17/43 |
| GeneSet | description | enrichmentRatio | pValue | FDR | GeneRatio |
|---|---|---|---|---|---|
| WP3945 | TYROBP Causal Network | 2.662484 | 0.0000230 | 0.0034332 | 16/25 |
| WP2877 | Vitamin D Receptor Pathway | 2.600082 | 0.0000002 | 0.0000612 | 25/40 |
| WP2328 | Allograft Rejection | 2.415560 | 0.0000468 | 0.0046499 | 18/31 |
| WP4718 | Cholesterol metabolism (includes both Bloch and Kandutsch-Russell pathways) | 2.377218 | 0.0001628 | 0.0097041 | 16/28 |
| WP2272 | Pathogenic Escherichia coli infection | 2.269162 | 0.0001429 | 0.0097041 | 18/33 |
| GeneSet | description | enrichmentRatio | pValue | FDR | GeneRatio |
|---|---|---|---|---|---|
| WP4240 | Regulation of sister chromatid separation at the metaphase-anaphase transition | 2.847521 | 0.0007687 | 0.0381795 | 9/13 |
| WP2328 | Allograft Rejection | 2.653604 | 0.0000021 | 0.0006250 | 20/31 |
| WP3613 | Photodynamic therapy-induced unfolded protein response | 2.570679 | 0.0012584 | 0.0468759 | 10/16 |
| WP466 | DNA Replication | 2.442145 | 0.0000219 | 0.0021771 | 19/32 |
| WP2864 | Apoptosis-related network due to altered Notch3 in ovarian cancer | 2.127458 | 0.0012346 | 0.0468759 | 15/29 |
| GeneSet | description | enrichmentRatio | pValue | FDR | GeneRatio |
|---|---|---|---|---|---|
| WP98 | Prostaglandin Synthesis and Regulation | 3.514148 | 0.0003836 | 0.0267002 | 8/12 |
| WP2118 | Arrhythmogenic Right Ventricular Cardiomyopathy | 3.012127 | 0.0016238 | 0.0450632 | 8/14 |
| WP2328 | Allograft Rejection | 2.890670 | 0.0000078 | 0.0023185 | 17/31 |
| WP4585 | Cancer immunotherapy by PD-1 blockade | 2.774327 | 0.0009815 | 0.0388446 | 10/19 |
| WP2877 | Vitamin D Receptor Pathway | 2.503830 | 0.0000340 | 0.0050675 | 19/40 |
| WP4541 | Hippo-Merlin Signaling Dysregulation | 2.306159 | 0.0010608 | 0.0388446 | 14/32 |
| WP4217 | Ebola Virus Pathway on Host | 2.021838 | 0.0000692 | 0.0068772 | 28/73 |
| GeneSet | description | enrichmentRatio | pValue | FDR | GeneRatio |
|---|---|---|---|---|---|
| WP197 | Cholesterol Biosynthesis Pathway | 4.922661 | 8.00e-07 | 0.0001256 | 10/12 |
| WP4240 | Regulation of sister chromatid separation at the metaphase-anaphase transition | 4.089595 | 3.99e-05 | 0.0039587 | 9/13 |
| WP4718 | Cholesterol metabolism (includes both Bloch and Kandutsch-Russell pathways) | 3.797481 | 0.00e+00 | 0.0000070 | 18/28 |
| GeneSet | description | enrichmentRatio | pValue | FDR | GeneRatio |
|---|---|---|---|---|---|
| WP477 | Cytoplasmic Ribosomal Proteins | 2.829528 | 0.0000000 | 0.0000000 | 59/84 |
| WP111 | Electron Transport Chain (OXPHOS system in mitochondria) | 2.332279 | 0.0000000 | 0.0000000 | 55/95 |
| WP623 | Oxidative phosphorylation | 2.184939 | 0.0000009 | 0.0000926 | 32/59 |
| WP2272 | Pathogenic Escherichia coli infection | 2.075278 | 0.0008059 | 0.0480303 | 17/33 |
| GeneSet | description | enrichmentRatio | pValue | FDR | GeneRatio |
|---|---|---|---|---|---|
| WP4629 | Computational Model of Aerobic Glycolysis | 4.331569 | 0.0000056 | 0.0004566 | 9/10 |
| WP1946 | Cori Cycle | 4.010712 | 0.0000061 | 0.0004566 | 10/12 |
| WP534 | Glycolysis and Gluconeogenesis | 2.776647 | 0.0000378 | 0.0018773 | 15/26 |
| WP477 | Cytoplasmic Ribosomal Proteins | 2.234540 | 0.0000001 | 0.0000221 | 39/84 |
| WP111 | Electron Transport Chain (OXPHOS system in mitochondria) | 2.077127 | 0.0000004 | 0.0000619 | 41/95 |
| WP183 | Proteasome Degradation | 2.062652 | 0.0001307 | 0.0055652 | 24/56 |
| GeneSet | description | enrichmentRatio | pValue | FDR | GeneRatio |
|---|---|---|---|---|---|
| WP2328 | Allograft Rejection | 5.513963 | 0.0000000 | 0.0000000 | 19/31 |
| WP455 | GPCRs, Class A Rhodopsin-like | 4.498233 | 0.0003354 | 0.0199926 | 7/14 |
| WP2118 | Arrhythmogenic Right Ventricular Cardiomyopathy | 4.498233 | 0.0003354 | 0.0199926 | 7/14 |
| WP2806 | Human Complement System | 4.048410 | 0.0001266 | 0.0125757 | 9/20 |
| WP4718 | Cholesterol metabolism (includes both Bloch and Kandutsch-Russell pathways) | 3.213024 | 0.0005183 | 0.0220667 | 10/28 |
| WP4298 | Viral Acute Myocarditis | 2.719862 | 0.0005012 | 0.0220667 | 13/43 |
| WP4217 | Ebola Virus Pathway on Host | 2.588025 | 0.0000220 | 0.0032847 | 21/73 |
| GeneSet | description | enrichmentRatio | pValue | FDR | GeneRatio |
|---|---|---|---|---|---|
| WP477 | Cytoplasmic Ribosomal Proteins | 7.776786 | 0.0000000 | 0.0000000 | 78/84 |
| WP4629 | Computational Model of Aerobic Glycolysis | 7.537500 | 0.0000000 | 0.0000059 | 9/10 |
| WP1946 | Cori Cycle | 6.281250 | 0.0000007 | 0.0000522 | 9/12 |
| WP1742 | TP53 Network | 4.568182 | 0.0007561 | 0.0321884 | 6/11 |
| WP534 | Glycolysis and Gluconeogenesis | 4.509615 | 0.0000002 | 0.0000227 | 14/26 |
| WP3982 | miRNA regulation of p53 pathway in prostate cancer | 3.908333 | 0.0008872 | 0.0330470 | 7/15 |
| WP3614 | Photodynamic therapy-induced HIF-1 survival signaling | 3.806818 | 0.0000882 | 0.0052565 | 10/22 |
| WP4286 | Genotoxicity pathway | 2.887931 | 0.0012647 | 0.0394404 | 10/29 |
| WP4018 | Pathways in clear cell renal cell carcinoma | 2.726744 | 0.0002737 | 0.0135956 | 14/43 |
| WP4290 | Metabolic reprogramming in colon cancer | 2.576923 | 0.0013235 | 0.0394404 | 12/39 |
| GeneSet | description | enrichmentRatio | pValue | FDR | GeneRatio |
|---|---|---|---|---|---|
| WP4494 | Selective expression of chemokine receptors during T-cell polarization | 6.881081 | 0.0000011 | 0.0001663 | 8/10 |
| WP619 | Type II interferon signaling (IFNG) | 5.913429 | 0.0000001 | 0.0000336 | 11/16 |
| WP455 | GPCRs, Class A Rhodopsin-like | 4.300676 | 0.0004453 | 0.0265410 | 7/14 |
| WP98 | Prostaglandin Synthesis and Regulation | 4.300676 | 0.0011796 | 0.0497529 | 6/12 |
| WP3624 | Lung fibrosis | 4.300676 | 0.0011796 | 0.0497529 | 6/12 |
| WP2328 | Allograft Rejection | 3.884481 | 0.0000026 | 0.0002556 | 14/31 |
| WP236 | Adipogenesis | 2.736794 | 0.0002701 | 0.0201234 | 14/44 |
| WP2877 | Vitamin D Receptor Pathway | 2.580405 | 0.0013356 | 0.0497529 | 12/40 |
| GeneSet | description | enrichmentRatio | pValue | FDR | GeneRatio |
|---|---|---|---|---|---|
| WP2328 | Allograft Rejection | 6.750331 | 0 | 0e+00 | 18/31 |
| WP477 | Cytoplasmic Ribosomal Proteins | 4.428789 | 0 | 0e+00 | 32/84 |
| WP4217 | Ebola Virus Pathway on Host | 3.822106 | 0 | 2e-07 | 24/73 |
| Factor | 1 | 2 | 3 | 4 | 5 | 6 | 7 | 8 | 9 | 10 |
| Signif_GO_terms | 0 | 0 | 0 | 0 | 0 | 1 | 5 | 5 | 8 | 0 |
| Factor | 11 | 12 | 13 | 14 | 15 | 16 | 17 | 18 | 19 | 20 |
| Signif_GO_terms | 5 | 5 | 7 | 3 | 4 | 6 | 7 | 10 | 8 | 3 |