Guided Factor Analysis on Unstimulated T Cell CROP-seq Data
-- 2 donors pooled, batch effect and 3 other covariates corrected
Yifan Zhou (zhouyf@uchicago.edu)
2021-04-22
1 Single cell expression data
Source:
Genome-wide CRISPR Screens in Primary Human T Cells Reveal Key Regulators of Immune Function, GEO accession: GSE119450.
Perturbations:
CRISPR knock-out of 20 genes (2 gRNAs per gene) + 8 non-targeting gRNAs. Guide conditions were defined on the target gene level; target genes were either found to regulate T cell responses in the genome-wide screens, or known checkpoint genes.
Guide RNAs were introduced into T cells through a novel procedure called sgRNA lentiviral infection with Cas9 protein electroporation (SLICE).
Cells:
Primary human CD8+ T cells from two healthy donors, without T cell receptor (TCR) stimulation.
Cells from 2 donors were pooled together into 1 analysis. All cells have only a single type of gRNA readout. Quality control resulted in 10644 cells.
Genes:
Only genes detected in > 10% of cells were kept, resulted in 5314 genes.
Normalization:
Seurat "LogNormalize": log(count per 10K + 1).
Batch effect, unique UMI count, library size, and mitochondria percentage were all corrected for. The corrected and scaled expression data were used as input for subsequent factor analysis.
2 Guided results
Here, our "guide", \(G\) matrix, consists of 21 types (20 genes + negative control) of KO conditions across cells.
In each case, Gibbs sampling was conducted for 2000 iterations, and the posterior mean estimates were averaged over the last 500 iterations.
2.1 SVD Initialization
2.1.1 Local False Sign Rate (LFSR)
For a given GSFA inference result, we can estimate the effect a certain KO condition \(m\) has on the expression of gene \(j\) by computing the LFSR of \(\beta_{m\cdot} \cdot W_{j\cdot}\).
Number of genes that passed GSFA LFSR < 0.05 under each perturbation:
Number of genes that passed t-test FDR < 0.05 under each perturbation:
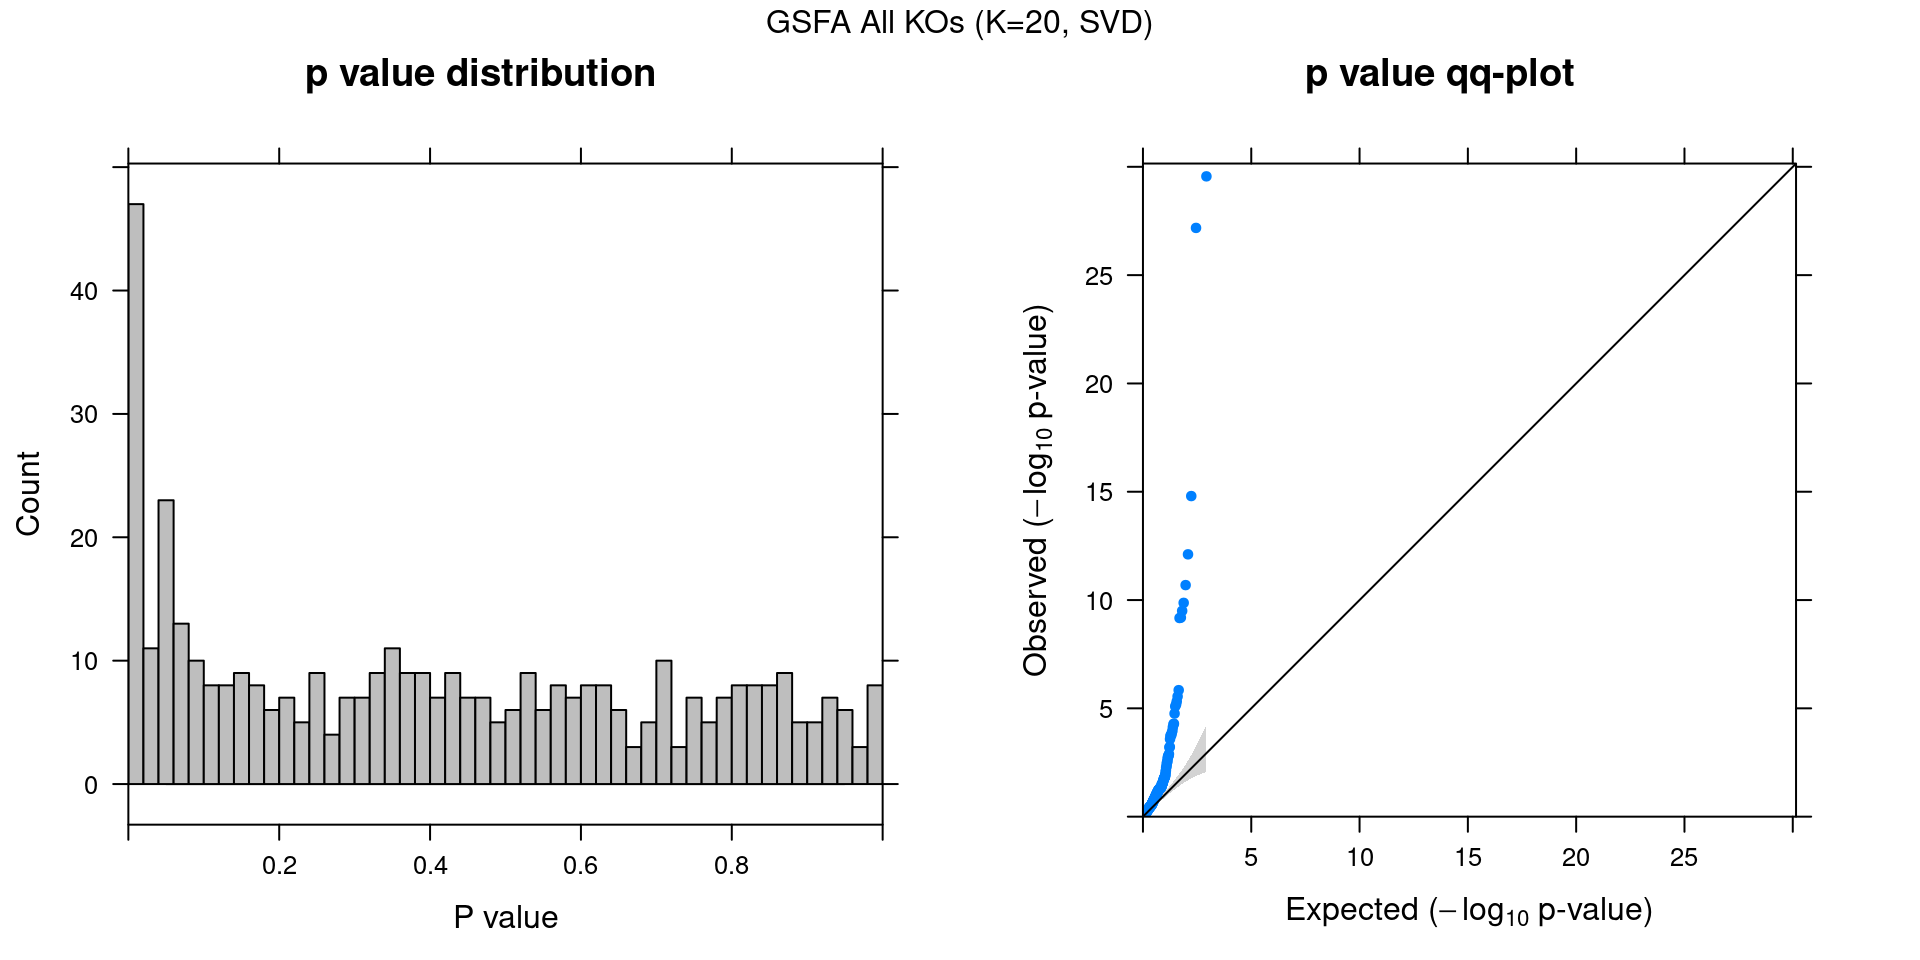
2.1.2 Estimate of Factor ~ Perturbation Associations (\(\beta\))
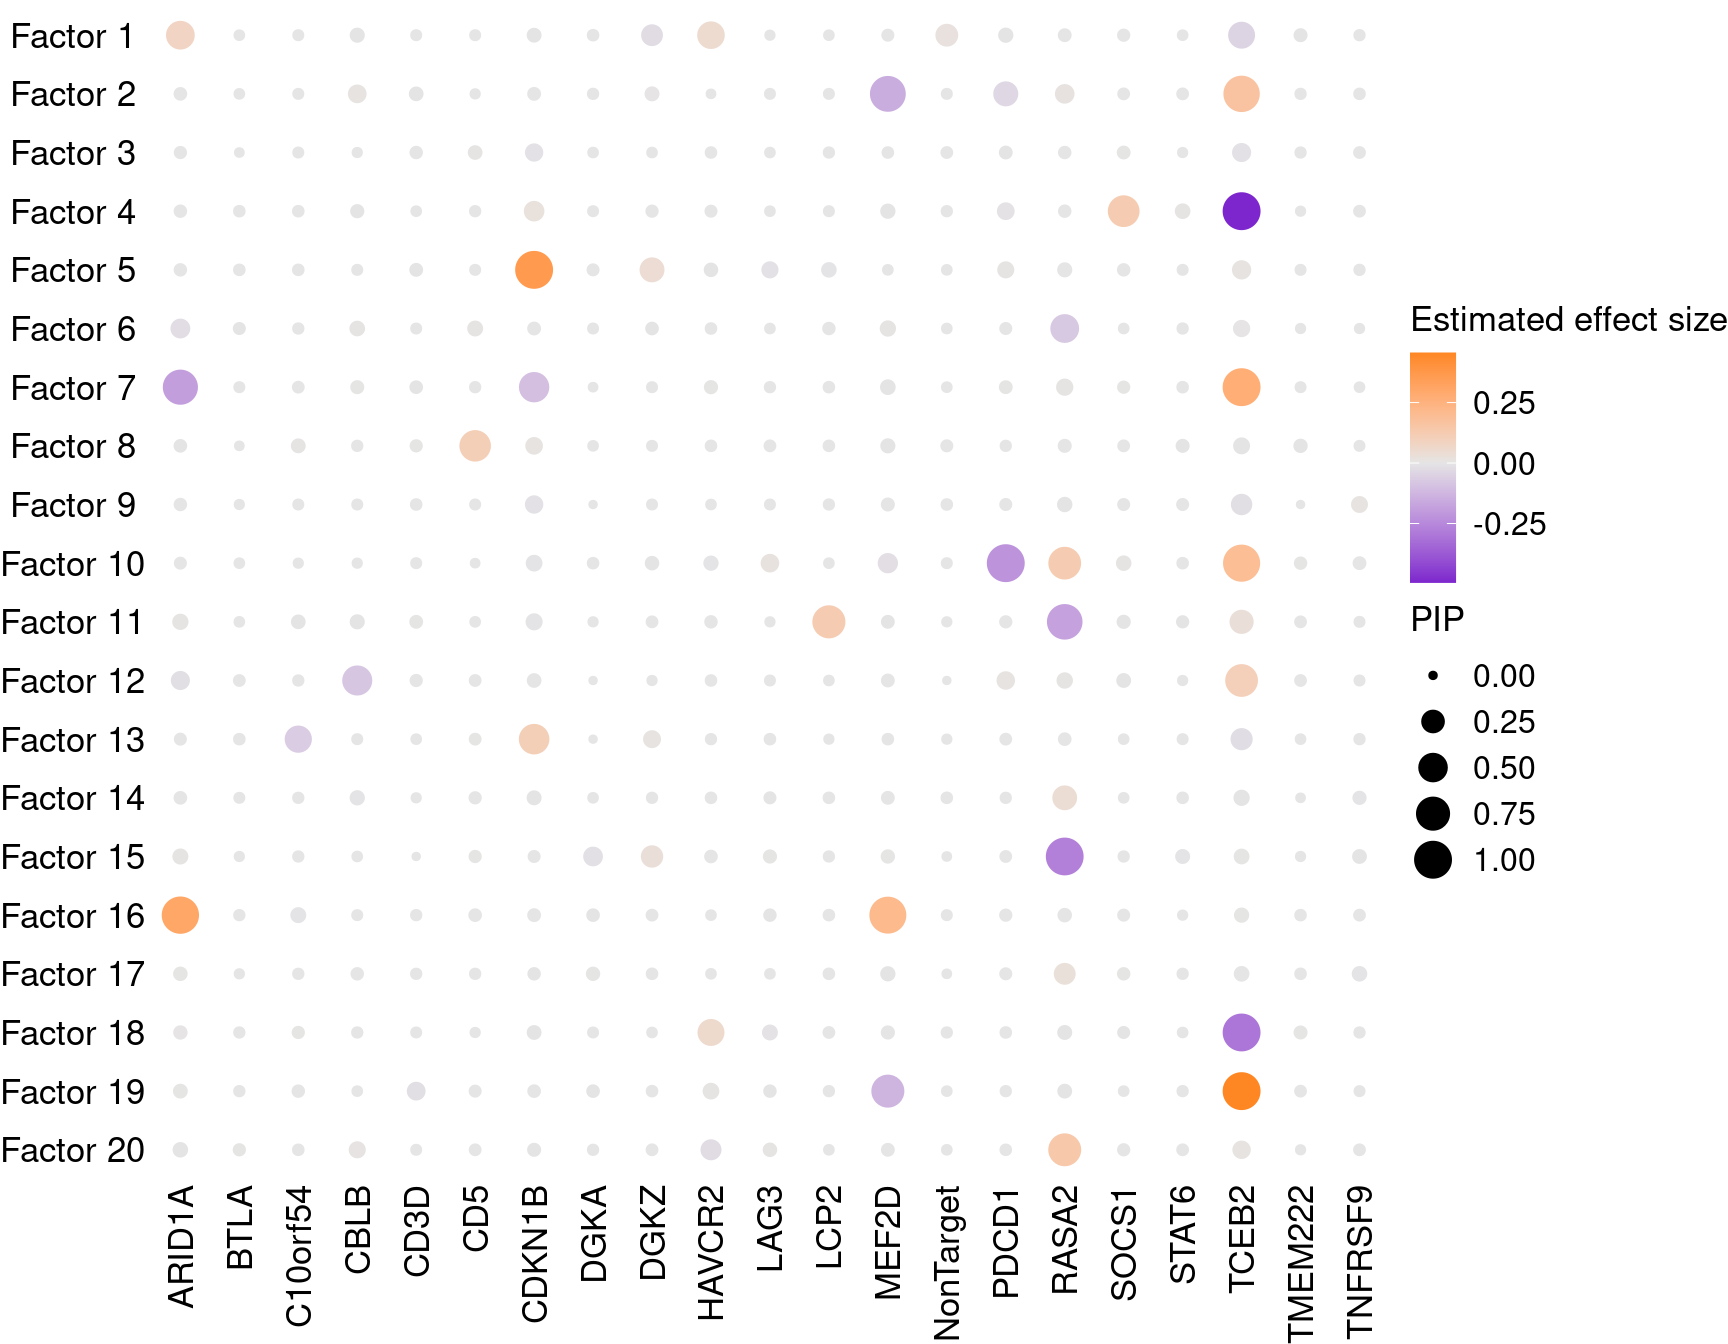
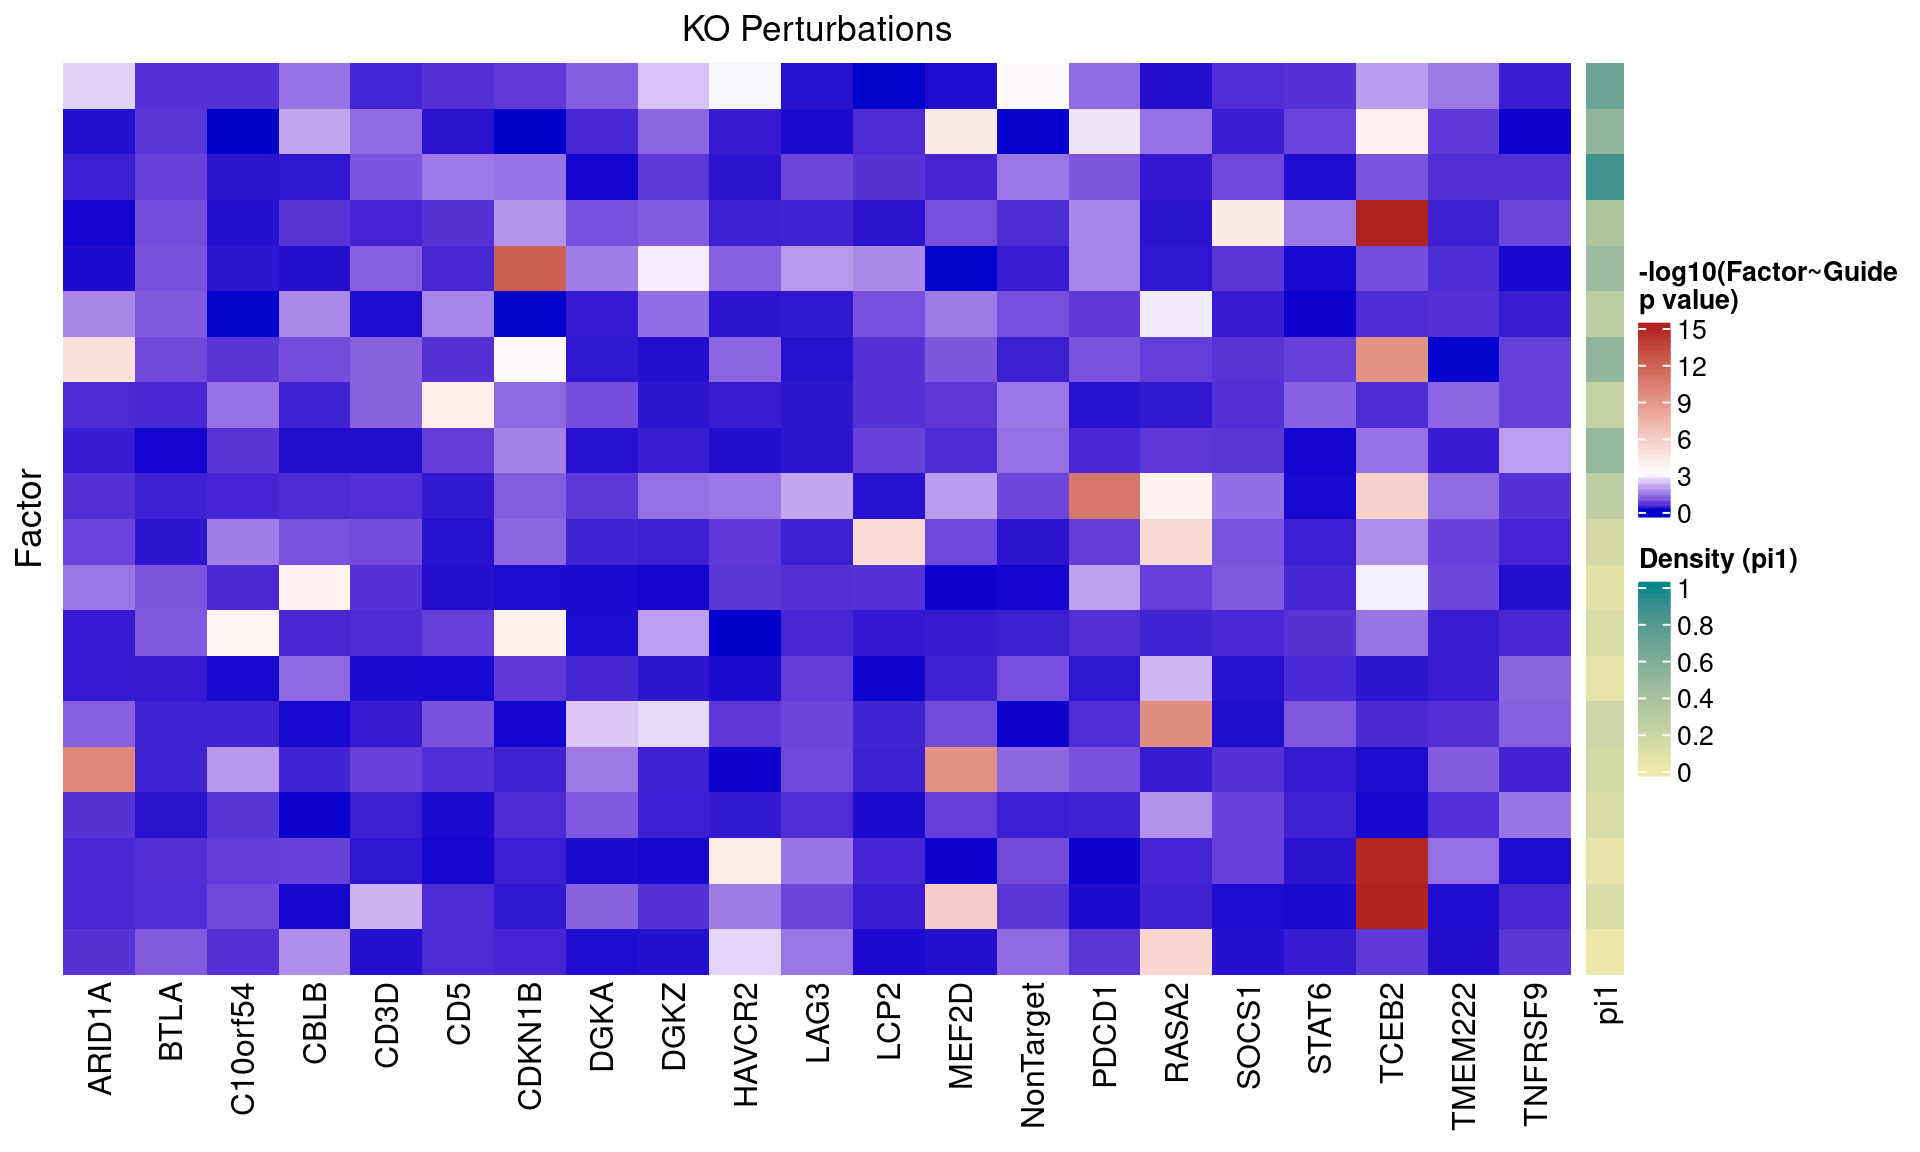
2.1.3 Factor ~ KO Posterior Association
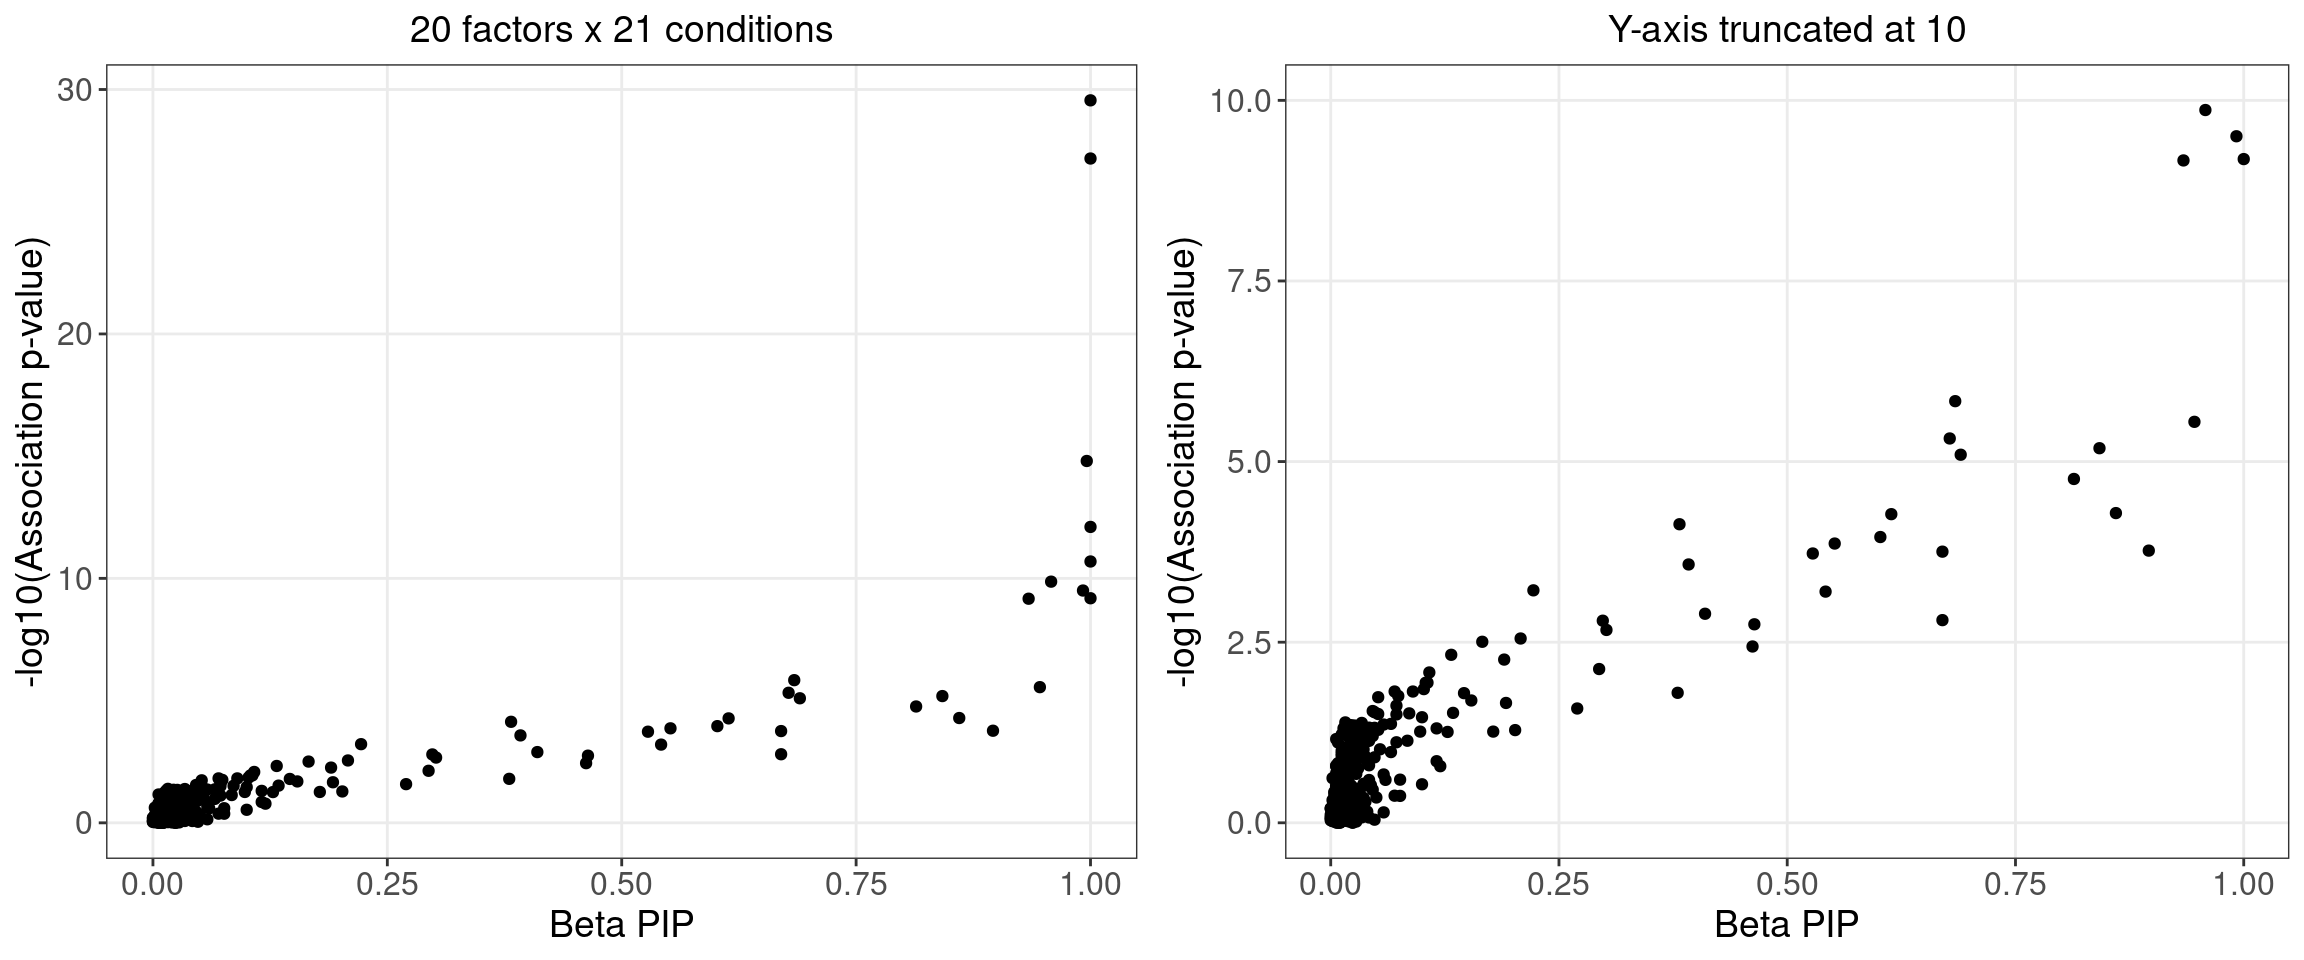
2.1.4 Beta PIP vs P-Value
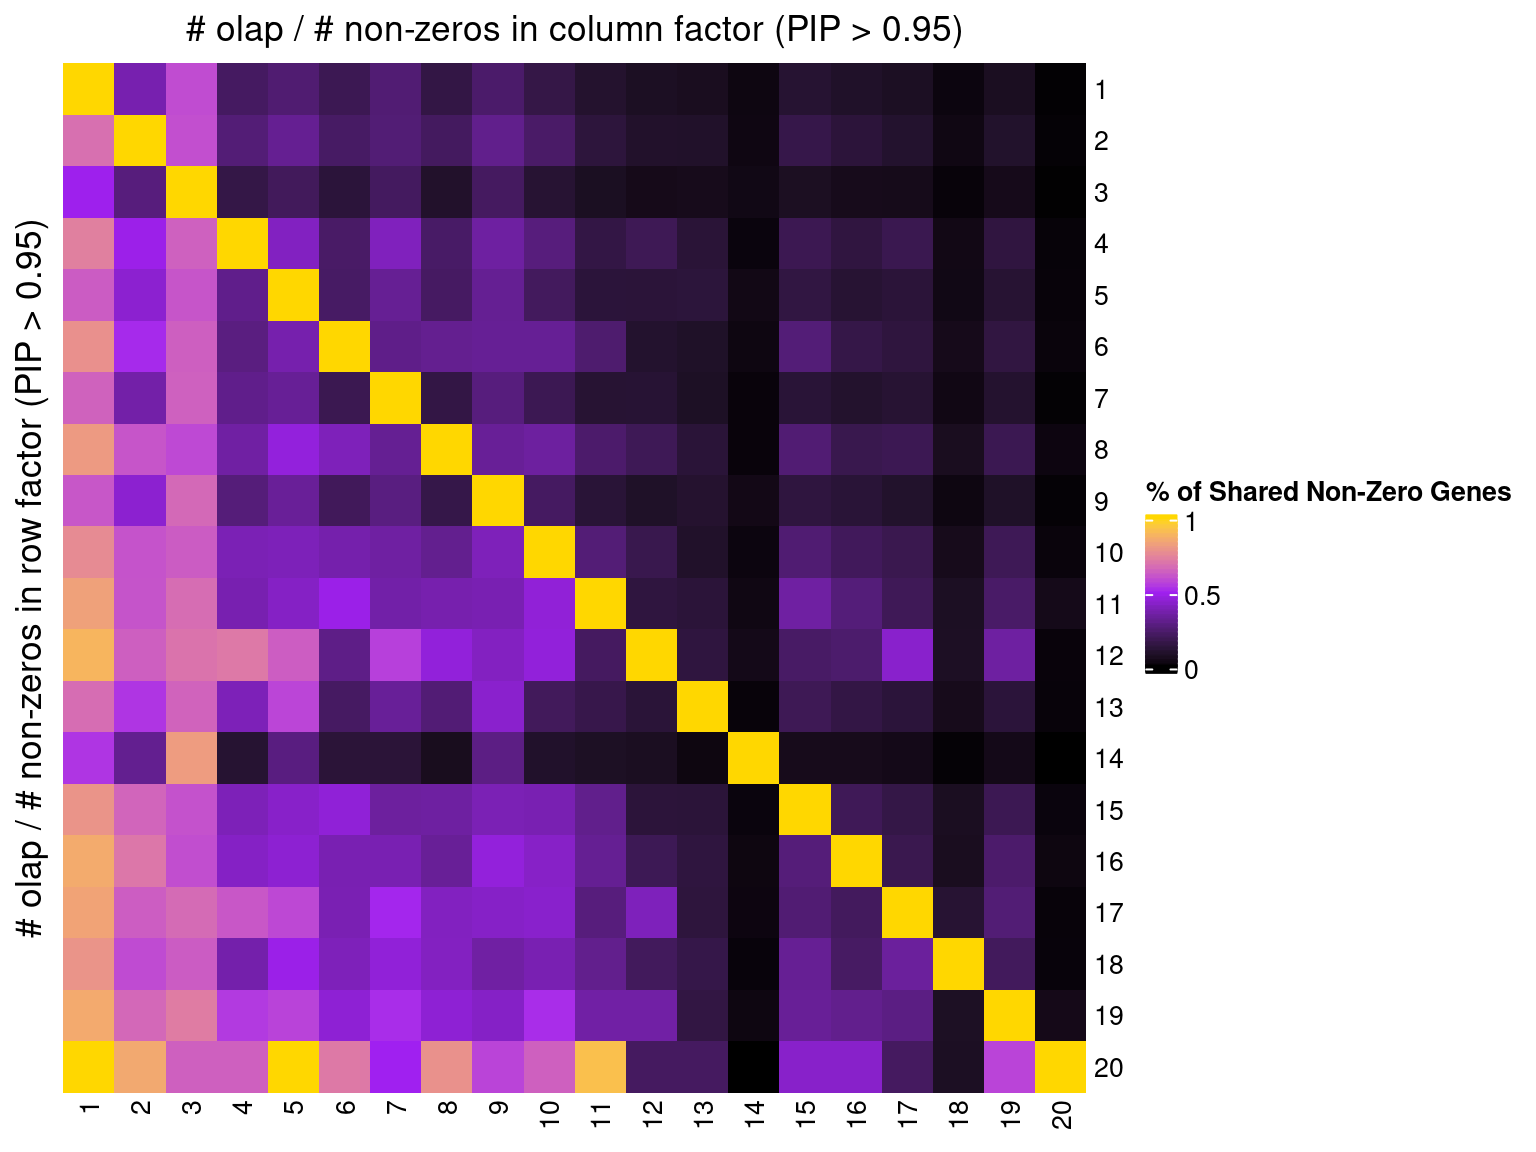
2.1.5 Correlation btw Factors
2.2 Alternative Initializations and Chain Convergence
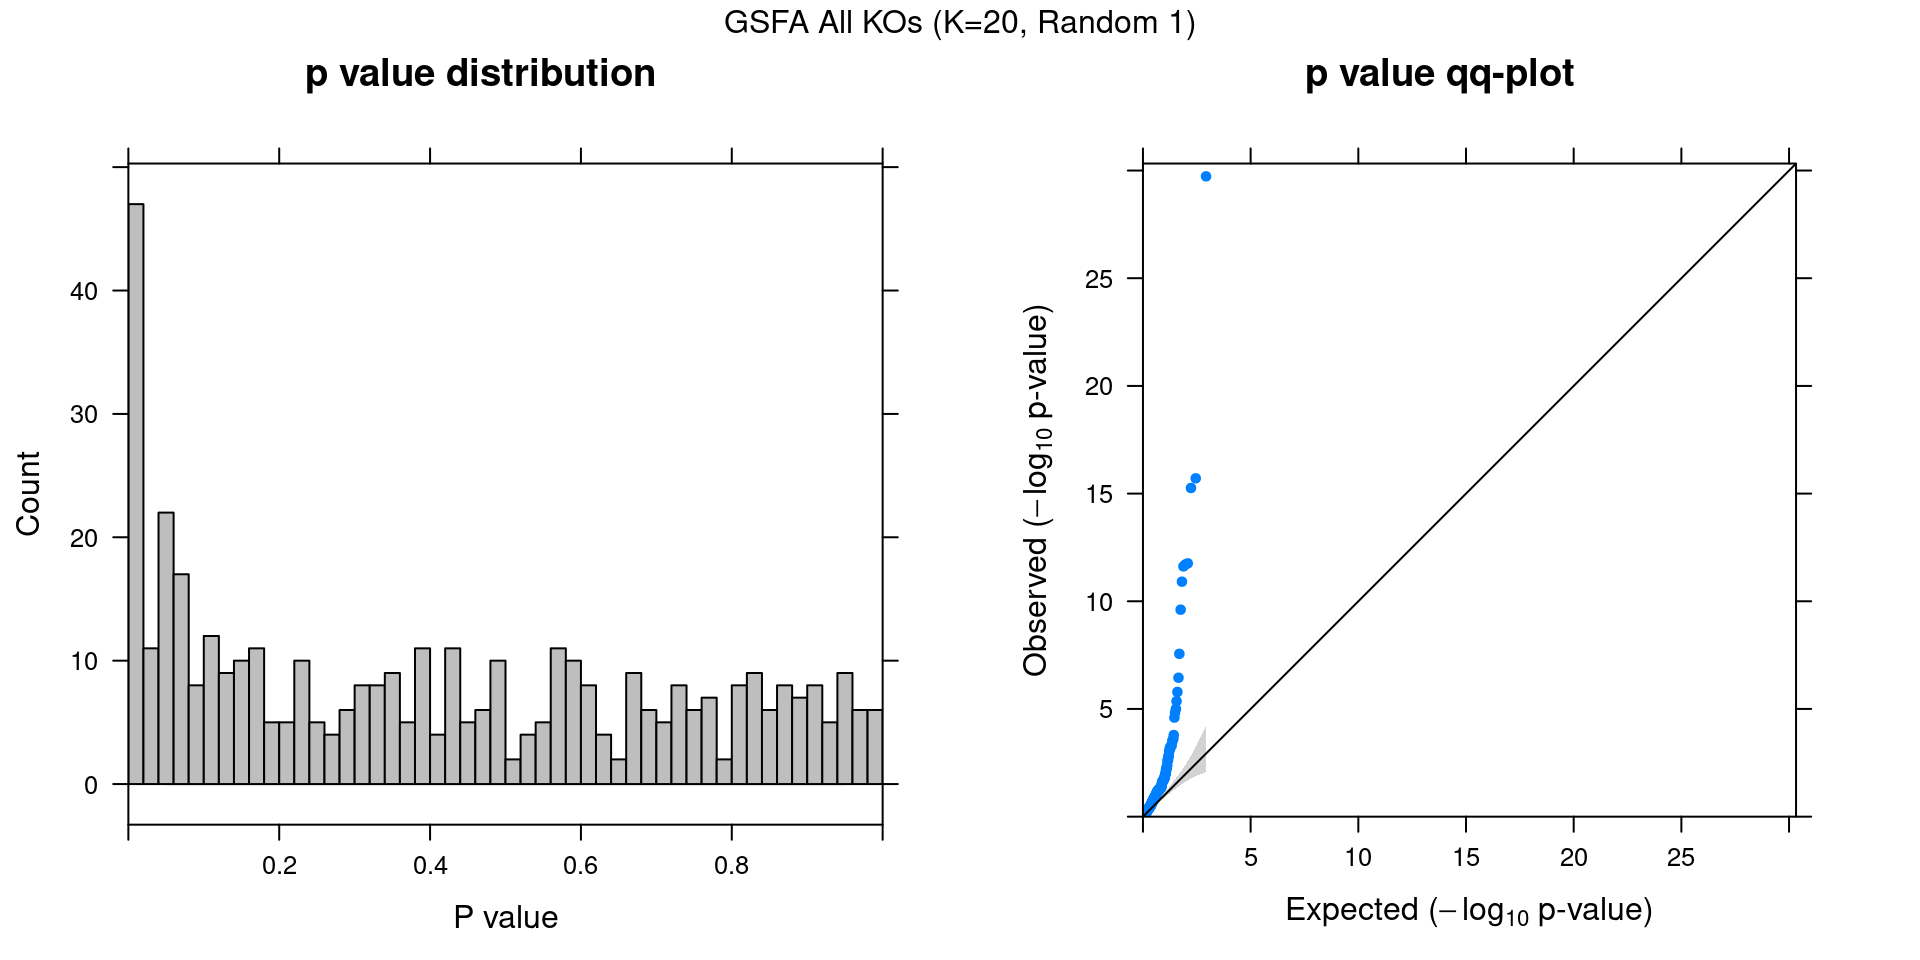
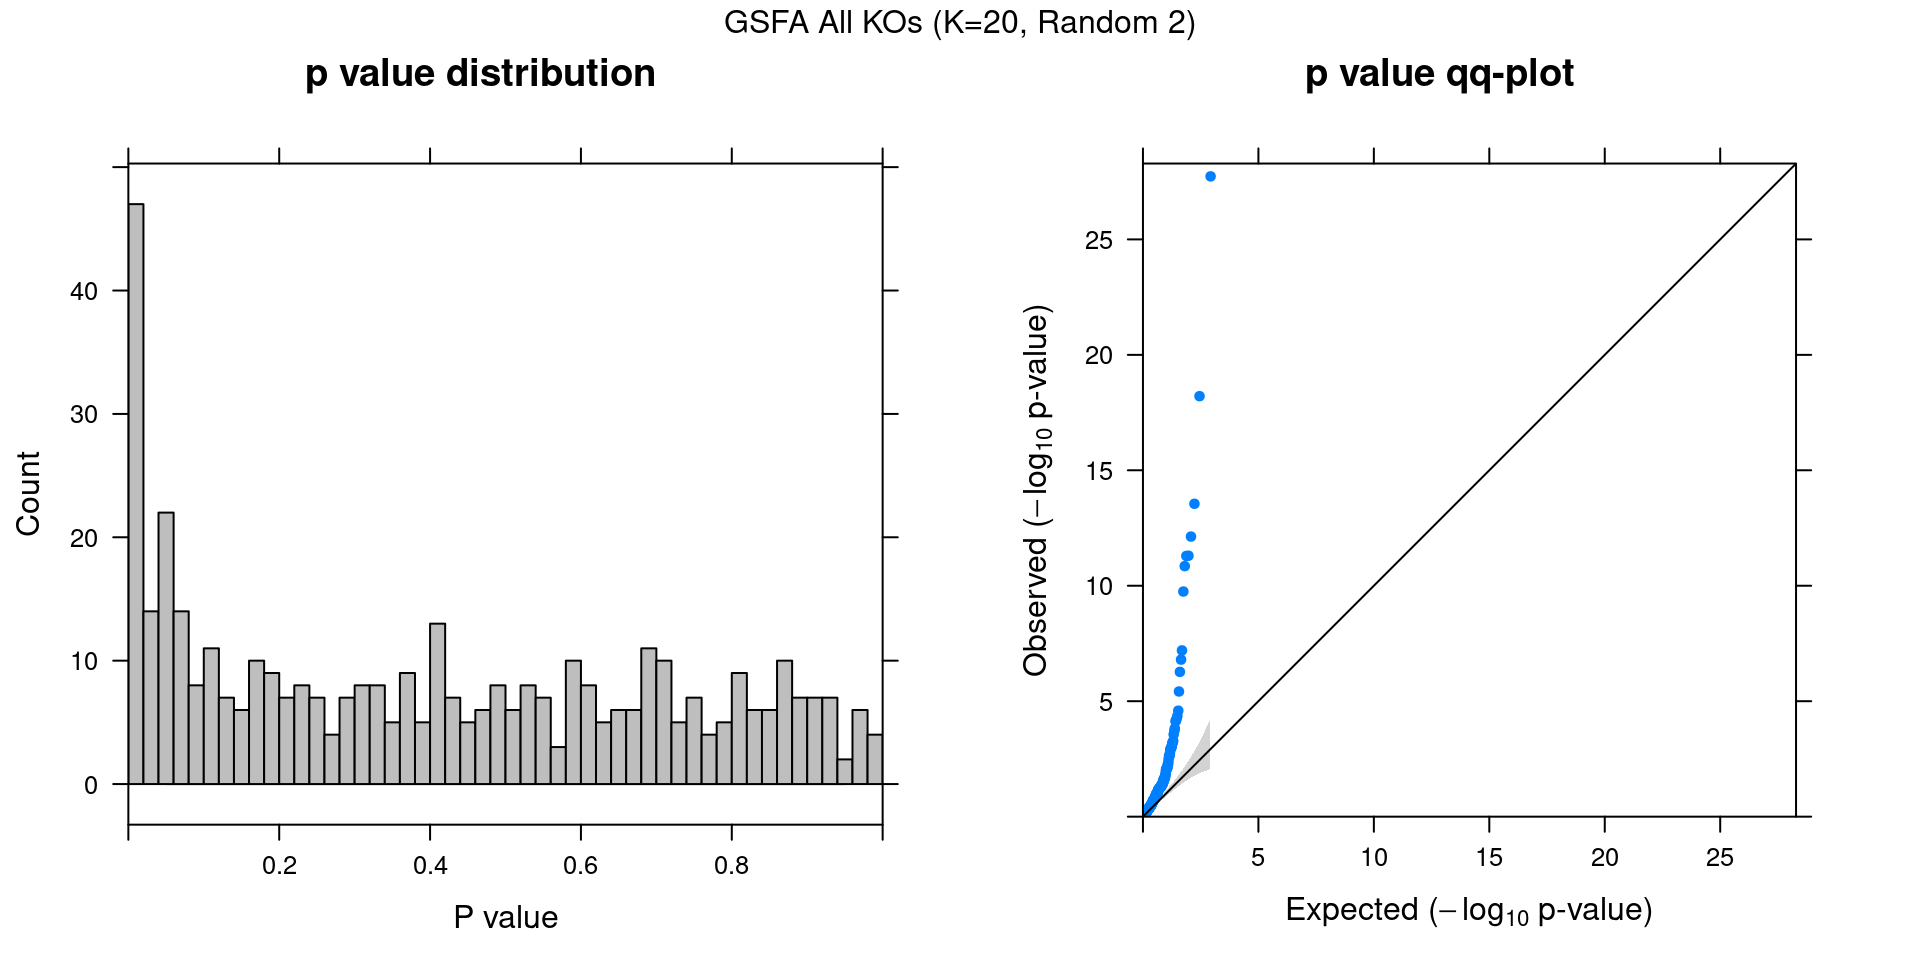
Other than initializing GSFA using truncated SVD, we also ran 2 chains with random initialization.
2.2.1 Association results for 2 randomly initialized GSFA runs
2.2.2 Chain mixing and convergence evaluation
| Min. | 1st Qu. | Median | Mean | 3rd Qu. | Max. | |
|---|---|---|---|---|---|---|
| ARID1A | 0.999 | 1.00 | 1.01 | 1.03 | 1.03 | 1.36 |
| BTLA | 0.999 | 1.00 | 1.00 | 1.00 | 1.00 | 1.00 |
| C10orf54 | 0.999 | 1.00 | 1.00 | 1.00 | 1.00 | 1.02 |
| CBLB | 0.999 | 1.00 | 1.00 | 1.00 | 1.00 | 1.12 |
| CD3D | 0.999 | 1.00 | 1.00 | 1.01 | 1.01 | 1.05 |
| CD5 | 0.999 | 1.00 | 1.00 | 1.00 | 1.00 | 1.05 |
| CDKN1B | 0.999 | 1.01 | 1.04 | 1.09 | 1.13 | 1.72 |
| DGKA | 0.999 | 1.00 | 1.00 | 1.00 | 1.00 | 1.02 |
| DGKZ | 0.999 | 1.00 | 1.00 | 1.01 | 1.01 | 1.10 |
| HAVCR2 | 0.999 | 1.00 | 1.00 | 1.00 | 1.00 | 1.03 |
| LAG3 | 0.999 | 1.00 | 1.00 | 1.00 | 1.00 | 1.02 |
| LCP2 | 0.999 | 1.00 | 1.00 | 1.00 | 1.00 | 1.27 |
| MEF2D | 0.999 | 1.00 | 1.01 | 1.01 | 1.01 | 1.14 |
| NonTarget | 0.999 | 1.00 | 1.00 | 1.00 | 1.00 | 1.01 |
| PDCD1 | 0.999 | 1.00 | 1.01 | 1.02 | 1.02 | 1.30 |
| RASA2 | 0.999 | 1.00 | 1.00 | 1.01 | 1.02 | 1.25 |
| SOCS1 | 0.999 | 1.00 | 1.01 | 1.04 | 1.06 | 1.29 |
| STAT6 | 0.999 | 1.00 | 1.00 | 1.00 | 1.00 | 1.01 |
| TCEB2 | 0.999 | 1.01 | 1.02 | 1.04 | 1.05 | 1.63 |
| TMEM222 | 0.999 | 1.00 | 1.00 | 1.00 | 1.00 | 1.01 |
| TNFRSF9 | 0.999 | 1.00 | 1.00 | 1.00 | 1.00 | 1.02 |
| offset | 0.999 | 1.00 | 1.00 | 1.00 | 1.00 | 1.01 |
2.2.3 Difference btw methods in factor estimation
For a pair of \(Z\) estimations from 2 inference methods, \(Z_1, Z_2\), we quantify the pairwise estimation difference as \(||Z_1Z_1^T - Z_2Z_2^T||_F/N\), where \(||\cdot||\) is the Frobenius norm of a matrix, and \(N\) is the number of rows (samples) in \(Z\).
Guided SVD vs Rand_01: 0.388
Guided SVD vs Rand_02: 0.377
Rand_01 vs Rand_02: 0.314
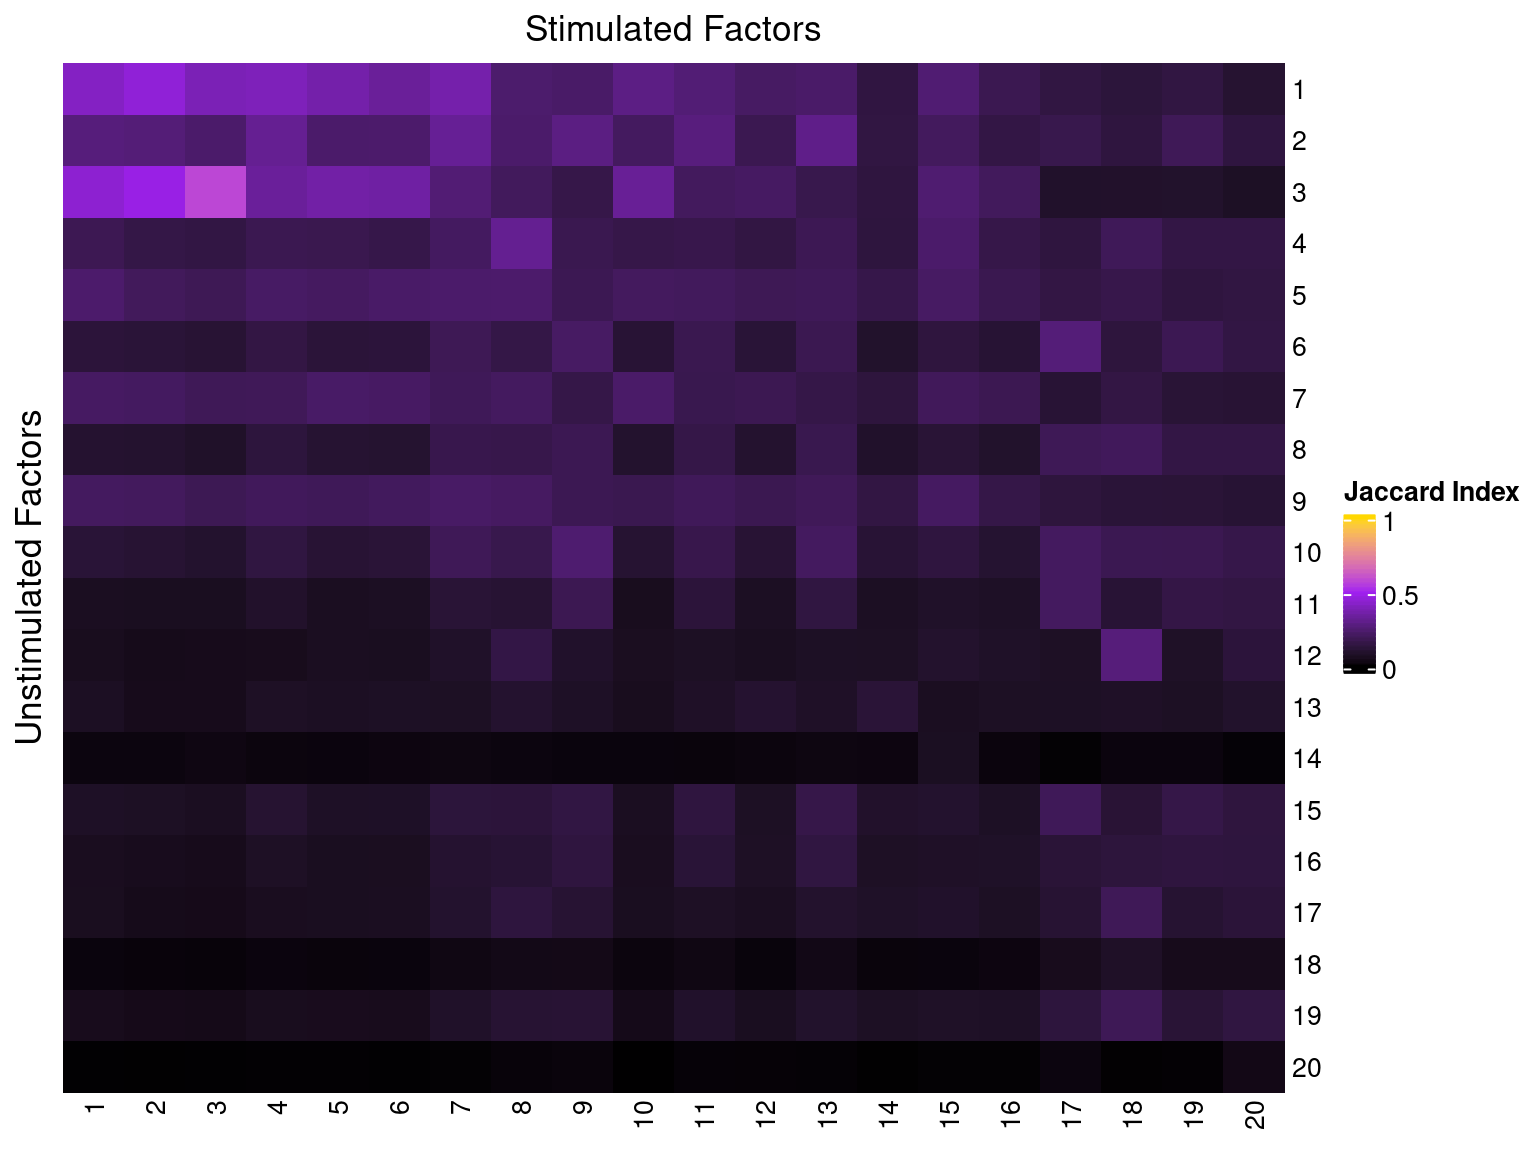
3 Comparison w/ Factors from Stimulated Cells
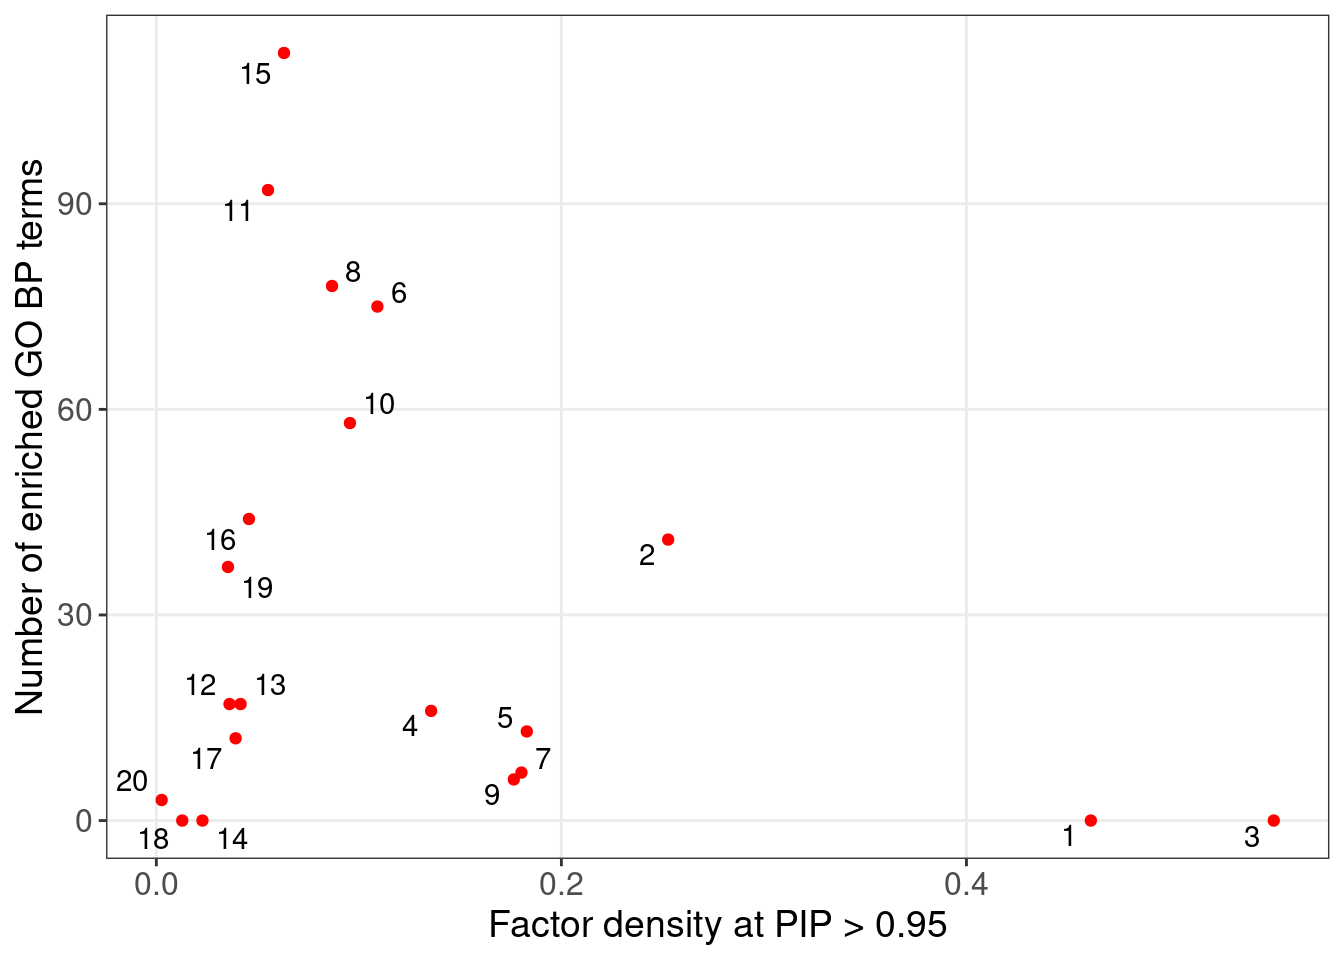
4 Gene Set Over-representation Analysis (ORA)
Target genes: Genes w/ non-zero loadings in each factor (PIP cutoff at 0.95);
Backgroud genes: all 6062 genes used in factor analysis;
Statistical test: hypergeometric test (over-representation test);
Only GO terms/pathways that satisfy fold change \(\geq\) 2 and test FDR \(<\) 0.05 are shown below.
4.1 GO Slim ORA
Gene sets: Gene ontology "Biological Process" (non-redundant).
Factor 2 : 41 significant GO terms
| Factor 4 : 16 significant GO terms |
|---|
| Factor 5 : 13 significant GO terms |
Factor 7 : 7 significant GO terms
| Factor 10 : 58 significant GO terms |
|---|
| Factor 11 : 92 significant GO terms |
Factor 15 : 112 significant GO terms
| Factor 16 : 44 significant GO terms |
|---|
| Factor 19 : 37 significant GO terms |
| Factor | 1 | 2 | 3 | 4 | 5 | 6 | 7 | 8 | 9 | 10 |
| Signif_GO_terms | 0 | 41 | 0 | 16 | 13 | 75 | 7 | 78 | 6 | 58 |
| Factor | 11 | 12 | 13 | 14 | 15 | 16 | 17 | 18 | 19 | 20 |
| Signif_GO_terms | 92 | 17 | 17 | 0 | 112 | 44 | 12 | 0 | 37 | 3 |
4.1.1 Factors of interest
4.2 Reactome Pathway ORA
Gene sets: The Reactome pathway database.
Factor 2 : 40 significant Reactome pathways
| Factor 4 : 44 significant Reactome pathways |
|---|
| Factor 5 : 51 significant Reactome pathways |
Factor 7 : 29 significant Reactome pathways
| Factor 10 : 45 significant Reactome pathways |
|---|
| Factor 11 : 39 significant Reactome pathways |
Factor 15 : 62 significant Reactome pathways
| Factor 16 : 40 significant Reactome pathways |
|---|
| Factor 18 : 38 significant Reactome pathways |
Factor 19 : 41 significant Reactome pathways
| Factor | 1 | 2 | 3 | 4 | 5 | 6 | 7 | 8 | 9 | 10 |
| Signif_GO_terms | 9 | 40 | 0 | 44 | 51 | 41 | 29 | 45 | 38 | 45 |
| Factor | 11 | 12 | 13 | 14 | 15 | 16 | 17 | 18 | 19 | 20 |
| Signif_GO_terms | 39 | 39 | 82 | 0 | 62 | 40 | 38 | 38 | 41 | 15 |
5 Gene Set Enrichment Analysis (GSEA)
WebGestalt parameter settings:
gene set size: 10-500, fdr < 0.1, num_perm: 1000, num_categories_expect: 10.
Gene weights \(W\) in each factor are used as the "fold changes" in GSEA;
1000 permutations were used to determine the significance of the enrichment score;
NES stands for normalized enrichment score, which is normalized to account for the size of each gene set;
Positive NES: genes in this set tend to be up-regulated;
Negative NES: genes in this set tend to be down-regulated.
Only gene sets within the size of 10 ~ 500 and have an enrichment FDR < 0.1 are kept.
5.1 Reactome pathway GSEA (all 6k genes)
Factor 2 : 37 significant Reactome pathways
| Factor 4 : 41 significant Reactome pathways |
|---|
| Factor 5 : 87 significant Reactome pathways |
Factor 7 : 28 significant Reactome pathways
| Factor 11 : 1 significant Reactome pathways |
|---|
| Factor 15 : 3 significant Reactome pathways |
Factor 16 : 4 significant Reactome pathways
| Factor 18 : 1 significant Reactome pathways |
|---|
| Factor 19 : 82 significant Reactome pathways |
5.2 Reactome pathway GSEA (only the genes w/ PIP > 0.95 in each factor)
Factor 2 : 38 significant Reactome pathways
| Factor 4 : 61 significant Reactome pathways |
|---|
| Factor 5 : 80 significant Reactome pathways |
Factor 7 : 63 significant Reactome pathways
| Factor 10 : 43 significant Reactome pathways |
|---|
| Factor 11 : 10 significant Reactome pathways |
Factor 15 : 7 significant Reactome pathways
| Factor 16 : 38 significant Reactome pathways |
|---|
| Factor 18 : 14 significant Reactome pathways |
Factor 19 : 38 significant Reactome pathways